
This report was funded by the Can Manufacturers Institute. However, Metabolic is an independent research organization and our assessment was not designed to support any particular outcome. We took an objective stance throughout the research process and have made our assumptions transparent in the report documentation. This work represents our own insights and recommendations based on our analysis. We welcome questions and feedback from anyone interested in discussing our assessment further.
Executive Summary
Over the last decade, the concept of a circular economy has gained significant support from businesses, governments, and the public as the way forward on solving some of the most pressing environmental challenges we currently face – from climate change to ocean pollution.
Our current economy is linear. We extract vast quantities of resources and use them (often very briefly) before throwing them away. Less than 10% of the materials that pass through our economy each year are recycled.1 Not only do many of these wasted materials end up polluting our environment; they also represent billions of dollars of value thrown in the trash. As just one example, an estimated 45 billion aluminum cans that could be recycled end up in landfills each year in the United States alone, representing $800 million of wasted value.
The urgency and benefits of moving toward a circular economy are clear. We need clean, stable secondary material streams that can compete with primary resource production. We need to keep those materials in circulation as long as possible at their highest and best use. Forever, if we can. The key question is: what actions do we need to take in order to make this transition happen?
Circular Potential
This report examines three beverage packaging materials in the United States (aluminum, glass, and PET plastic2) to understand their current level of circularity and identify what actions are required to bring these product systems into fully circular operations. Combining a life cycle impact assessment and a dynamic material flow model of how material recovery would change over time under different scenarios, we conclude that:

Aluminum Cans
Aluminum cans have the highest circular potential of the three materials evaluated, particularly in the current U.S. recycling system. When considering sorting and processing losses, nearly 82% of aluminum in used beverage cans (UBCs) entering the U.S. recycling system is recovered and remelted for high-quality closed-loop recycling. However, the annual recycling rate for UBCs hovers around 50%, representing significant potential for improvement through increased collection. The production of virgin aluminum is very resource intensive, but using secondary aluminum instead drastically reduces environmental impact. Aluminum cans produced in the United States have an average recycled content of 73%, coming from both pre- and post-consumer aluminum scrap.
The maximum closed-loop recycled content limit for aluminum cans is currently 90%, with the remaining 10% coming from primary aluminum to adjust the alloy composition.3 The tops of aluminum cans are currently made of a different alloy than the can body, which blend together when recycled along with other types of aluminum scrap, requiring primary aluminum to maintain key material properties. To increase this recycled content limit and reach a fully circular closed-loop system, aluminum beverage cans would need to be redesigned to be made of a single alloy – a move that presents several systemic drawbacks, such as increased material use and higher costs. Instead, we recommend investing in new recycling technologies that separate the can top from the can body alongside investments in alloy sorting technologies to maintain key material properties while raising the recycled content ceiling for aluminum cans.
1 Haas et al. (2015). 2 PET stands for polyethylene terephthalate, the most common plastic type used in beverage containers. 3 Technically, aluminum manufacturers can also adjust the alloy composition using aluminum scrap with the right alloy properties to create a can made of 100% recycled content. In practice, however, primary aluminum is often used due to economic reasons and reliability of primary aluminum supply.

Glass Bottles
Our model shows that glass has the second highest circular potential of the three materials evaluated. Glass collected in single-stream recycling systems often ends up downcycled or discarded: 40% is sent to landfills, 40% is recycled into fiberglass or containers, and 20% is used for low-value applications. By contrast, 97% of the glass collected in deposit systems can be recovered for high-value recycling. Since nearly half of the glass collected for bottle-grade recycling comes from the 10 states that have implemented deposit return systems, we calculate that 59% of glass collected in the U.S. recycling system can currently be turned back into glass bottles for closed-loop recycling.
The amount of valuable raw materials like silica and soda ash that can be saved through increased glass recycling is tremendous, adding up to an additional 9 billion pounds of glass cullet per year for bottles produced in the United States. However, since the glass recycling process within the current energy system has limited life cycle CO2e improvements over virgin glass production, the most promising pathway toward circularity for glass is to focus on product reuse. While reusable glass bottles require a thicker design, glass bottles can be washed and refilled up to 25 times before needing to be recycled, which also eliminates the need to harvest raw materials for glass production. To maximize the circular impact reduction potential of glass, bottle deposit systems should be expanded and redesigned towards localized glass bottle refill/reuse systems, with unusable bottles directed towards glass recycling.

PET Bottles
Based on our model, PET currently has the lowest circular potential of the three materials investigated, as only 13% of collected PET is currently converted back into food-grade recycled PET (rPET). While additional rPET is directed towards other beneficial uses, such as fibers and films, these products are less likely to be recovered again for continued high-value recycling. The material properties of PET degrade when it is recycled (around one-third of PET is lost during mechanical recycling processes) and there are significant challenges with incorporating recycled PET into food grade applications. For these reasons, we find it unlikely that recycled PET will systematically displace the production of virgin PET in the current U.S. recycling system.
Another challenge is that virgin PET prices fluctuate with the price of oil, which has consistently made it difficult for rPET to compete on price with virgin material. The pathway toward a circular PET system is much more challenging than for the other two materials examined. It rests critically on much purer material collection (for example, through deposit return systems) and on the development of economically and environmentally viable chemical recycling solutions.4 While some companies are exploring refillable PET systems with thicker bottles as a potential strategy to reduce their material footprints, reusing plastics can be problematic due to sterilization issues and buildup of contaminants, and these bottles still face the same systemic recycling issues at the end of their useful life.
4According to the “Breaking the Plastic Wave” report released by Systemiq (2020), chemical recycling of plastics has not yet been proven at scale, and has higher costs and emissions compared to mechanical recycling. This highlights the importance of decarbonizing energy sources alongside investments in scaling up chemical recycling technologies.
Aluminum Can Recycling: A Leverage Point for Impact Reduction
The impact reduction potential of reaching a 100% collection rate for used beverage cans is significant. We calculate that once a 100% deposit collection rate is achieved for each material type, the total emissions impact reduction potential for recovering one metric ton of aluminum cans is 3 times higher than PET bottles and 42 times higher than glass bottles. Not only are aluminum cans the most valuable of the three materials from an economic perspective, they are also the most valuable to recycle from an emissions impact reduction perspective.
When compared to current recycling rates in the United States, the impact of recycling 100% of aluminum cans has the potential to save an additional 6 million metric tons of CO2e each year – the equivalent of the annual CO2e emissions from electricity used in over 1 million U.S. homes. To put the quantity of increased UBC collection in perspective, doubling the current annual collection rate of aluminum cans adds the same amount of aluminum to the U.S. economy as dismantling 7,500 airplanes – equivalent to the entire U.S. commercial aircraft fleet.

Doubling the current annual collection rate of aluminum cans adds the same amount of aluminum to the U.S. economy as dismantling 7,500 airplanes – equivalent to the entire U.S. commercial aircraft fleet.
Once collection rates reach 100%, the same piece of aluminum could be used over multiple recycling loops with the only material losses occurring in the shredding and remelting processes at a 94% combined efficiency rate. When stretched over 40 recycling loops, we calculate that one aluminum can recycled over and over again has the potential to displace the material equivalent of 15 aluminum cans.
Key Recommendations
Ensuring that all products and materials are designed to cycle at their highest value is about much more than just optimizing the existing recycling system. Changes are required across all the steps of the value chain – from product design to material collection – in order to ensure that recovered resources are actually displacing virgin material and continuing to circulate at high value. In fact, this study shows that we cannot reach a circular system simply by maximizing recycling under current conditions. Key actions need to be taken across these product value chains to make progress toward a fully circular system in the U.S. beverage packaging sector:
- Business models and collection incentives need to be aligned for each material type (e.g., glass should be driven toward refillable systems; aluminum cans toward increased recycling; and plastic towards deposit return systems).
- Collection rates for all three materials must be dramatically increased. This can happen by increasing curbside collection while advocating for deposit return systems – such as the bottle bill system – to be rolled out across the United States.
- While bottle bill deposit systems are being set up, PET producers should invest in chemical recycling technologies and critically assess the life cycle impacts of these processes, shifting towards renewable sources of energy if impacts are high.
- The aluminum industry should explore new recycling technologies that separate the can top from the can body in the recycling process. This would help maintain aluminum alloy properties over multiple recycling loops and raise the recycled content ceiling for aluminum cans. In general, all containers should be designed in a way that minimizes the chance of mixing materials or alloys in the recovery process, for example by removing unnecessary design features to improve the quality of recovered materials.
- Material recovery facilities should invest in additional eddy current technologies, which magnetize and separate aluminum from other material types, to ensure all aluminum cans that enter the recycling system can be sorted correctly for recycling.
- Decision-makers should monitor progress toward circularity not just by measuring and acting upon recycling rates, but also by evaluating annual rates of material displacement,5 measuring whether materials collected for recycling are used in open-loop or closed-loop systems, determining whether materials are recycled into products that can easily be recycled again, monitoring the material and energy efficiency of the recycling process, and quantifying the impact of interventions from a systems-oriented life cycle perspective.
- Finally, beverage producers should explore reducing the need for beverage packaging altogether by investing in drink concentrates, home-based beverage systems, and other solutions that meet consumers’ needs while reducing overall packaging production.
By implementing these key recommendations, we have the potential of achieving a fully circular beverage packaging system. This coordinated effort will require action from politicians, manufacturers, and consumers: we must all collaborate to reach a circular future.
5 Displacement refers to the actual amount of primary material demand that is reduced as a result of material reuse or increased secondary (recycled) material production.
Definitions
Linear Economy:
References a particular way in which materials flow within an economic system. It is commonly used to characterize our current economic model, which follows a “take-make-dispose” pattern where most materials are disposed of after a single use and cannot be recovered for continued circulation. In a linear economic model, the creation of value is fundamentally dependent on the ever-expanding production and sale of goods, which requires continual extraction of natural resources.
Circular Economy:
This is an alternative to the current linear model; it is waste-free by design, leverages renewable resources, and equitably generates economic, natural, and social capital safely within the planetary boundaries. It acknowledges that we live on a planet with finite resources, and therefore aims to retain valuable and critical materials flowing in the economic system at their highest and best value.6
Raw Material Displacement:
Refers to the reduction of virgin materials required in the production of goods by increasing the use of secondary materials or reducing demand of virgin materials through product reuse.
Displacement Rate:
An economic indicator that represents the percentage of raw materials that are no longer extracted and produced because of increased supply of secondary (recycled) materials or reduced demand through product reuse, from a system wide perspective.
Closed-Loop Recycling:
Refers to reintegrating recycled materials back into the same type of product without significant losses in material quality or functionality. In this paper, we use bottle-to-bottle and can-to-can recycling as a proxy for closed-loop recycling, to highlight the circular potential of recovering and reusing these materials at the same quality over multiple recycling loops.
Open-Loop Recycling:
Refers to using recycled materials in products that differ from the original product system, typically changing the material quality or function. If the material loses significant quality or value, this can also be referred to as downcycling.
6 See Metabolic’s Seven Pillars of the Circular Economy framework for more information: https://www.metabolic.nl/news/the-seven-pillars-of-the-circular-economy

Introduction
Over the last decade, the concept of a circular economy has gained significant popularity as a potential pathway for solving some of the most pressing environmental challenges we currently face – from climate change to ocean pollution. Our current economy is linear. We extract vast quantities of resources, use them (often very briefly), and then send them to landfills or disperse them into the environment in a way that they are unrecoverable – for example, through incineration, the dispersal of chemicals, or the use of products like paints that are not designed for recovery. Less than 10% of the materials that pass through our economy each year are recycled.7Not only do many of these wasted materials end up polluting our environment; they also represent billions of dollars of value thrown in the trash.
By contrast, a circular economy is waste-free and regenerative by design, where our production and manufacturing are modeled much more closely after nature and material resources are designed to cycle indefinitely at high value. As you walk through a forest, you can be sure that everything you see around you, from the soil to the birds, is part of a continuous, regenerative cycle where nothing ever becomes “waste.” We should design our industrial systems in line with circular principles. So what are the steps to make that happen?
In this study we applied dynamic modeling techniques to look at the U.S. beverage packaging sector and explore what it would take to bring it to a fully circular state. Our conclusions vary drastically for each of the three main types of materials we investigated, and, perhaps surprisingly for many, the pathway to circularity does not simply rely on increasing levels of recycling. Recycling represents one part of a larger system that needs to work properly to maintain a functioning circular economy. Products need to be designed for circularity, incentives need to be put in place for high-quality and pure material recovery, and value chain partners need to collaborate on everything from reverse logistics8 to the creation of a robust market for secondary materials. All of these changes require a broader systems transformation. We recommend using additional metrics – such as material displacement – to more accurately track our progress on the journey toward a circular economy.
7 Haas et al. (2015). 8 Reverse logistics refers to the process of moving materials away from disposal and back into the product value chain for recycling, reuse, or remanufacturing. Lacy et al. (2020).
Toward a Circular Beverage Packaging System
Each year, the average U.S. citizen consumes 800 beverages packaged in disposable containers, primarily made of aluminum cans, PET plastic, and glass bottles.9 While over half of U.S. households have access to curbside recycling services,10 the majority of these 200+ billion containers end up in the trash, resulting in significant economic and environmental losses. Even aluminum cans, which are the most recycled beverage container in the United States and the world,11 have a recycling rate in the U.S. of only around 50%.12 An estimated 45 billion aluminum cans end up in landfills each year in the United States alone, representing $800 million worth of material that is being thrown away.13 That’s the equivalent of each U.S. citizen tossing nearly a dozen 12-packs of used aluminum cans in the trash every year.

Around 45 billion aluminum cans end up in landfills each year in the United States alone. That’s the equivalent of each U.S. citizen tossing nearly a dozen 12-packs of used aluminum cans in the trash every year.
For a material like aluminum with both a high circular potential and high raw material production footprint, this is a huge waste. Not only is the economic value of this aluminum thrown away,13 but the embodied energy, water, and GHG emissions associated with producing these cans are also squandered.
Criteria for a circular system
A circular system starts with circular design. This involves selecting materials and designing products in a way that allows materials to be easily broken down and reintegrated back into production (or fully biodegrade into natural systems) at the end of their useful life. Recycled materials can either be turned back into the same type of product (closed-loop recycling) or used in a different product system (open-loop recycling).14 In some cases, products can be designed in a way that allows for multiple cascading loops over several product lifetimes, as material properties change or degrade over time.
The environmental benefits of creating a strong circular system come from displacing primary resource production – in other words, ensuring that recycled materials are actually used to create new, high-quality products instead of the virgin resources that would otherwise be used. Setting up a system that allows materials to circulate at their highest and best use typically reduces the demand and associated impacts of harvesting raw materials.15 Displacement can also be achieved through other strategies such as product reuse. Every decision made in a circular economy should be done in a way that maximizes impact reduction potential and allows materials to be circulated at their highest and best use, indefinitely.
In a properly functioning circular system, permanent materials such as aluminum and glass could, in theory, be used forever. In practice, however, there’s no such thing as an inherently circular product or material, since all materials have the potential to be handled in a non-circular way. Circular products and materials only exist within a functioning circular system that supports the collection, handling, processing/reuse, and reintegration of these materials back into production systems.
9 Gitlitz, J. (2013). 10 Mouw et al. (2020). 11 Can Manufacturers Institute. (Oct 24, 2017). 12 The Aluminum Association. (2019). 13 Lee, G. (November 15, 2019). 14 In this paper, we use bottle-to-bottle and can-to-can recycling as a proxy for closed-loop recycling, to highlight the circular potential of recovering and reusing these materials at the same quality over multiple recycling loops. 15 Displacement refers to the actual amount of primary material demand that is reduced as a result of material reuse or increased secondary (recycled) material production. In practice, the actual displacement rate is highly dependent on economic factors. As noted in Zink (2018), reaching a 100% displacement rate is unlikely. However, setting up a strong market for secondary materials that compete with primary materials can improve the displacement rate and associated impact reduction potential of a circular intervention.
Circular products and materials only exist within a functioning circular system that supports the collection, handling, processing/reuse, and reintegration of these materials back into production systems.
A circular system puts recycling rates into context
To achieve a truly circular system, we need to go beyond just talking about recycling rates. We need to focus on ensuring circular systems are designed in a way that maximizes impact reduction potential, prioritizes high-value material recovery, and displaces primary raw materials.
If we only discuss material recycling rates, we focus the conversation on the amount of material collected and diverted from landfills. That is only part of the recycling story. Instead, we should assess whether the recycled materials are actually being used at their highest and best value – and whether, therefore, they are replacing the need for as much new, virgin material to be introduced. A successful recycling system should create a strong and reliable source of secondary materials that can compete with primary resource production.
A successful recycling system should create a strong and reliable source of secondary materials that can compete with primary resource production.
This can be achieved by designing products and processes that facilitate continued circulation at high value with minimal losses, highlighted in Figure 1.

Assessing the circularity of beverage containers in the U.S. recycling system
In this paper, we assess three key packaging materials – aluminum cans, PET bottles, and glass bottles – on their circular potential in the U.S. context.16
Our analysis dives into the following topics:
Chapter 1: Design
We discuss how the material properties of each beverage container determine how these products should be designed for a circular system.
Chapter 2: Production
We assess the life cycle impacts of producing each material, with an eye towards whether material recovery will result in significant reductions in energy, water, and GHG emission impacts across the three packaging types.
Chapter 3: U.S. Recycling System Assessment
We map out how each material is currently being collected, processed, and recovered in the current U.S. recycling system in a material flow analysis, highlighting the key system leverage points that inhibit reaching a circular state.
Chapter 4: Intervention Scenarios
We model the potential for circularity by improving the U.S. recycling system through three hypothetical scenarios: increased collection, improved sorting technologies, and implementing a national bottle deposit system.
Finally, we provide recommendations for stakeholders across the beverage container value chain to participate in creating a robust circular system by prioritizing strategies that maximize impact reduction potential and allow materials to circulate at their highest and best use.
16 We excluded beverage cartons from this analysis due to a lack of publicly-reported data tracking the rate of multi-layer carton recycling in the United States. According to the Carton Council, the curbside recycling rate of beverage cartons was 16% in 2019, but the trade group has not reported the methodology for calculating this recycling rate. We urge the Carton Council to report recycling data and methodology to the EPA to allow for a comparison across all beverage container types.
01 Design
Design is destiny. The way a product is designed, and the inherent properties of the materials it is made of, greatly influence whether the product is destined for continuous circulation or eventual disposal. This is quite apparent when comparing aluminum cans, glass bottles, and PET bottles. If a product is designed in such a way that it remains a high-value material resource at the end of its useful life, then producers won’t have to source virgin raw materials to continue manufacturing that product and can instead rely on using materials already in circulation. Let’s dive into the details.
How do the material properties of PET, glass, and aluminum influence the packaging’s circular potential over infinite recycling loops?
Aluminum Cans
Aluminum is touted as a highly circular, infinitely recyclable material that doesn’t degrade in the recycling process. Because of this, the International Aluminum Institute estimates that 75% of aluminum ever produced is still in use today. Cans are designed as a single-use product, which are shredded and remelted directly back into the aluminum production system. When the aluminum can was originally designed over 60 years ago, recycling and waste reduction goals were a key part of the full system design.18
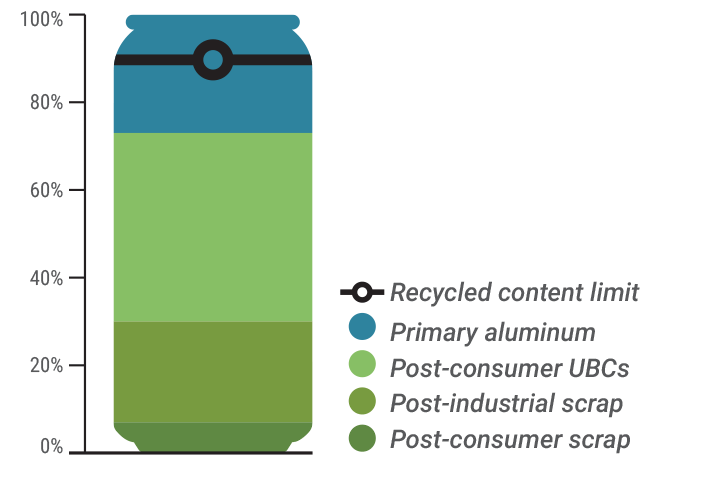
Aluminum cans are actually made of two different types of aluminum alloys — the result of advancements in can lightweighting efforts. The can body, which makes up about 80% of the can by weight, is made of a 3104 alloy with higher levels of manganese than the rest of the can. The top and tab are made of a 5182 alloy with comparatively higher levels of magnesium.19 Both alloys allow for high levels of recycled content from a variety of sources. When recycled, however, the alloy types mix together and require additional material inputs to re-balance the different alloy properties.
Therefore, some primary aluminum is still required to balance out impurity elements and to maintain the can’s alloy properties. Because of this, the aluminum can has a theoretical recycled content limit of around 90%.20 This represents one barrier for the aluminum can system to completely break away from virgin material production.21
A unialloy aluminum can is technically possible,22 but creating a unialloy aluminum can is not practical from a systemic perspective. A unialloy can design would require additional material to strengthen the can, which would increase material and production costs. In addition, a thicker unialloy can would result in higher material losses for every can that is not properly collected and recycled, plus additional aluminum lost in the shredding process. Alternatively, the aluminum industry can explore new recycling technologies that separate the top from the body in the can recycling process, moving towards a system that separates and maintains alloy purity over multiple recycling loops.
Today’s average aluminum can in the U.S. is made of 73% recycled content, with 43% of a can coming from collected used beverage cans (UBCs), as shown in Figure 2.
Aluminum cans also contain a thin lining made of epoxy resin to keep the beverage from interacting with aluminum. To break away from petroleum-based plastics used in cans, the can manufacturing industry should explore investing in biobased epoxies as a potential substitute,25 preferably using secondary feedstocks to reduce primary material consumption.26
As will be described in Chapter 2, the environmental performance of an aluminum can is highly dependent on the amount of recycled aluminum in the product. Since the alloy used in aluminum cans is highly forgiving, and because the recycling process is highly efficient, producers should actively prioritize sourcing recycled content for aluminum cans and eliminate any unnecessary raw material inputs.
17 Betram et al. (2017).18 Buffington, J. (2012). See also Anton (2019) on how Bill Coors designed the aluminum can with recycling in mind. 19 Buffington, J., & Peterson, R. (2013).20 Based on literature review and conversations with aluminum can manufacturers. See also Novelis (2013) introducing an aluminum can made from 90% recycled content. 21 Technically, aluminum manufacturers can also adjust the alloy composition using aluminum scrap with the right alloy properties to reach a 100% recycled content aluminum can, but in practice primary aluminum is often used due to economic reasons and reliability of primary aluminum supply. 21 Buffington, J., & Peterson, R. (2013). 23 The Aluminum Association. (2019). 24 Part of the post-industrial scrap category includes the “class scrap” that is cut off from sheets of aluminum during the can manufacturing process. This is the ideal closed-loop recycling scenario, since the scrap material exactly matches the alloy requirements for both the can body and top. In addition, this class scrap does not include any contaminants such as coatings, shrink wraps, and plastic closures, which are commonly found in post-consumer materials. These extra packaging design elements reduce efficiency and increase costs for recyclers, so these additions should be minimized to improve the economic viability of aluminum UBC recycling. 25 Roudsari et al. (2017). 26 Fernandes et al. (2018).
The properties of aluminum allow the material to be sorted and separated in material recovery facilities (MRFs) via eddy currents from mixed waste streams at around 95% effectiveness.27 Eddy currents collect all types of aluminum, including aluminum foil, resulting in bales of mixed aluminum which are sold for continued processing. Aluminum can also be recovered from bottom ash after incineration, which provides an additional source of recycled aluminum to the system. However, to maintain material purity and high recovery rates, UBC collection through traditional recycling methods is preferred. Deposit systems provide the cleanest UBC material streams, which is the best option for a closed-loop recycling system.
Based on these design considerations, recycled aluminum cans have a high potential to displace primary aluminum production, as long as the collection infrastructure and systems are in place to provide a reliable supply of secondary materials that meet alloy specifications. Since aluminum recycles forever, creating a reliable collection system allows new cans to be made from the same aluminum over and over again.
Since aluminum recycles forever, creating a reliable collection system allows new cans to be made from the same aluminum over and over again.
The processing infrastructure is already in place to continue circulating aluminum cans at scale. However, since many different types of aluminum alloys are collected and recycled together, the aluminum can system will continue to require additional raw material input until systems are in place to efficiently separate and sort different types of aluminum alloys for continued recycling. Technologies such as laser spectroscopy can rapidly assess and sort mixed aluminum sources by alloy types,28 reducing the need for primary aluminum to re-balance alloy specifications in the remelting process.
Looking beyond what the aluminum can industry can do alone, particularly considering the high displacement potential for aluminum, the challenge for the aluminum industry overall is to monitor the rate that total primary aluminum demand actually decreases with increased recycling rates. This requires coordination across the aluminum value chain (beyond just can manufacturing) to expand the recovery of high-value secondary materials that can compete with – and ultimately reduce – primary aluminum production. The environmental impact savings associated with aluminum recycling are highly dependent on the raw material displacement rate, so the aluminum industry overall should prioritize monitoring raw material displacement while increasing recycling rates to strengthen its sustainability story and environmental performance.
The aluminum industry should prioritize monitoring raw material displacement while increasing recycling rates to strengthen its sustainability story and environmental performance.
27 Simmons, S. (2020). 28 For example, see “New sorting system for separating aluminum alloys” featured in Recycling Magazine in 2016: https://www.recycling-magazine.com/2016/10/17/new-sorting-system-for-separating-aluminium-alloys/. See also: Kuzuya, M. (2019).
Glass Bottles
Glass, like aluminum, is also a permanent material, which means glass maintains its physical properties throughout the recycling and recovery process.29 Recycled glass cullet30 can easily be integrated back into the bottle production system with minimal losses. On this metric alone, glass would seem to have a potential to reduce its impact through recycling, but in practice the potential for creating high-value secondary markets for glass is less promising.
Glass is heavy and breaks easily. The heavy weight means glass requires more material to deliver the same amount of beverage to consumers, resulting in a higher environmental footprint and increased transportation impacts compared to the other packaging types.31 Broken glass is difficult to manage, particularly in single-stream recycling systems. Furthermore, the low (or negative) value of collected glass often means the material ends up being used for low-end applications or landfill cover, rather than for high-end applications that displace virgin glass production. Given these considerations, the likelihood that glass collected in the recycling process will provide a consistent enough supply to compete with primary glass production is quite low.
Of the glass bottles collected in single-stream recycling systems, 40% is recycled into fiberglass or glass containers, 20% is glass fines (small, broken glass) used in low-end applications, and 40% is sent to landfills. In comparison, 97% of the glass collected in deposit systems can be recovered for high-value recycling.32 Because of the cleaner material streams from deposit systems, nearly half of the glass collected for bottle-grade recycling comes from the 10 states that have implemented bottle bill legislation.33
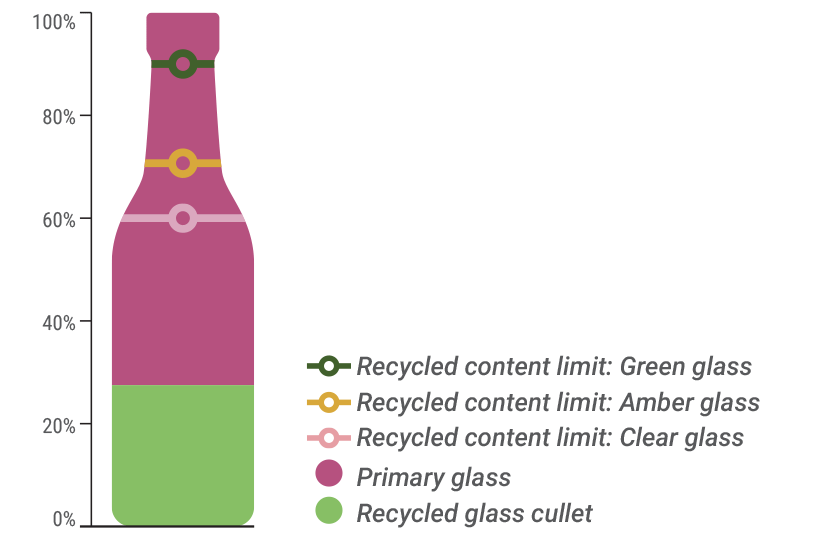
The average recycled content of glass bottles is around 27.5%.34 The maximum recycled content limit depends on the color of the bottle, since each color type can tolerate different levels of color contamination, shown in Figure 3.35 Green glass has the highest recycled content limit at 90%, followed by amber glass at 70% and clear (flint) glass at 60%. Because of these color contamination constraints, glass must be sorted by color as part of the recycling process before it can be reused for bottle production.
Since the vast majority of energy and GHG impacts occur in the glass manufacturing process, which the recycled glass also undergoes, the environmental savings associated with glass recycling are actually quite minimal when compared to the other packaging types. 36 Because glass bottles are durable and can be sterilized, the best strategy for glass bottles to reduce life cycle impacts and displace primary material production is to prioritize reuse.
Because glass bottles are durable and can be sterilized, the best strategy to reduce life cycle impacts and displace primary material production is to prioritize reuse.
This will require setting up a strong network of glass bottle collection, sterilization, and reverse logistics, prioritizing local networks to reduce transportation impacts. Reusable glass bottles may need to be designed with additional material to ensure product durability over multiple use cycles. However, glass bottles can be reused up to 25 times before being disposed of or recycled,37 which greatly improves the potential for raw material displacement and associated impact reduction potential. Once glass bottles can no longer be reused, the material should be collected and recycled back into new bottles.
29 Geueke et al. (2018). 30 Glass cullet refers to crushed glass ready to be remelted in the glass recycling process. 31 See Section 2 and Appendix 1 for more details. 32 Gitlitz, J. (2013).; Majdinasab, A., & Yuan, Q. (2019).; Damgacioglu et al. (2018). 33 The Container Recycling Institute. (2020). 34 Average glass recycled content based on LCA estimates from Franklin (2018, 25%), RTI (2003, 27.5%), and Franklin (2009, 30%). 35 Dyer, T. (2014). 36 Described in more detail in Section 2. 37 Cattaneo, J. (March 12, 2019).
PET Bottles
PET is a lightweight and durable material that makes it easy to transport and distribute goods. However, unlike aluminum and glass, PET is a non-permanent material that loses material properties in the mechanical recycling process. Because of this, PET can be recycled a maximum of 10 times before the polymer chains are no longer usable for high-grade purposes.38 The number of times PET can be recycled is higher than for other types of plastic, some of which can only be recycled 2-3 times before the material quality is no longer sufficient for high-value reuse.39
In a closed-loop system, the recycled content ceiling for PET bottles is highly dependent on the material purity of the collected materials in the recycling system. A recent study shows that PET bottles collected and recycled through mono-collection systems (such as bottle deposits) allow for higher amounts of recycled content compared to PET bottles collected in mixed recycling systems (such as single-stream recycling).40 This is because contamination in the mechanical recycling process over multiple cycles changes critical PET properties such as haziness, yellowing, and migration of volatile compounds.
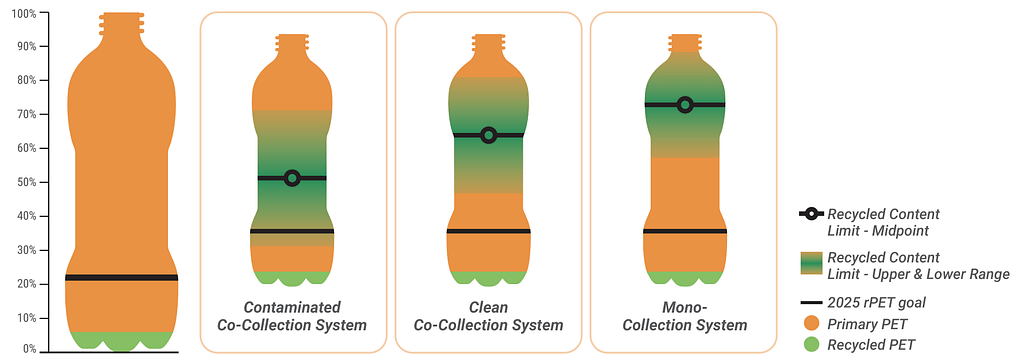
While producing a 100% recycled PET bottle is technically feasible, the practical recycled content limit for PET in a closed-loop system depends on the material purity of the collection system, along with the contamination acceptance limits set by the producing company. Brouwer et al. (2020) explore the recycled content limits for PET bottles in a closed-loop system across three critical properties. Recycled content limits for mono-collection systems range from 51% – 93% (midpoint: 72%), clean co-collection systems range from 37% – 83% (midpoint: 60%), and more contaminated co-collection systems range from 16% – 70% (midpoint: 43%).41 Therefore, increasing the recycled content of PET bottles should go hand-in-hand with improving the collection methods in a circular system.
Increasing the recycled content of PET bottles should go hand-in-hand with improving the collection methods in a circular system.
See the gradients in Figure 4 for the PET recycled content limit ranges for each collection method.
In the United States, the current recycled content of PET bottles is estimated to be around 6%.42 Packaged goods companies who have signed the New Plastics Economy Global Commitment have set goals to reach 22% post-consumer recycled content in their packaging by 2025.43 However, the recent “Talking Trash” report by Changing Markets Foundation (2020) uncovers how voluntary commitments by large producers to increase recycled content and improve material collection have been largely ineffective in curbing plastic pollution.44 Furthermore, these same producers have consistently lobbied against rolling out bottle bill deposit return legislation that has been proven to improve the quality and quantity of collected materials for recycling.
According to research by Closed Loop Partners, the current supply of post-consumer recycled plastics can only reach 6% of total recycled plastics demand.45 The Recycling Partnership estimates that an additional 1.6 billion pounds of PET bottles will need to be collected in the U.S. in order to reach a 25% recycled content goal for PET bottles.46 That’s the equivalent of each U.S. citizen recycling 100 more PET bottles each year. This would require the U.S. PET recycling rate to increase by 27%, assuming all additional rPET is diverted towards food grade plastics – which is unlikely in the current U.S. recycling system since around 75% of rPET is used for non-food applications.
38 Spary, S. (September 27, 2019). 39 National Geographic. (April 4, 2018). 40 Brouwer et al. (2020). 41 See Brouwer et al. (2020), Table 3 for a more detailed breakdown for recycled content limits for lenient and strict thresholds across three critical parameters, including haziness, yellowing, and migration. 42 NAPCOR & APR. (2018). 43 Kersten-Johnston et al. (2019).; New Plastics Economy. (2019). 44 Changing Markets Foundation. (2020). 45 Closed Loop Partners. (2019). 46 Kersten-Johnston et al. (2019).
There are many barriers to achieving recycled content goals for PET in the United States, particularly for food-grade plastics. Incorporating rPET into food packaging requires the material to be traced back to food-grade sources,47 which is most effectively achieved through bottle deposit systems. Chemical recycling opens up new opportunities for PET recycling that can bypass food-grade rPET recycling restrictions, but scaling up chemical recycling needs to go hand-in-hand with decarbonizing energy sources.48
In addition, the economic viability of recycled PET is highly dependent on the price of oil. As seen in the current COVID-19 crisis, when the price of oil plummeted, so did the price of virgin PET,49 while the costs to produce rPET remained the same. When considering the billions of subsidy dollars that fossil fuels receive from the U.S. government,50 petrochemicals used to make virgin PET will almost certainly continue to have artificially low prices and outcompete rPET on the open market. Unless paired with a cross-industry commitment to scale back PET production in line with increased recycled content commitments, the total amount of PET put on the market will continue to grow – as will the total amount of PET disposed.
These factors do not bode well for the impact reduction potential of PET in the U.S. market. Unless producers have a reliable feedstock of recycled materials at a low price to reduce demand for virgin PET, the market demand for virgin PET will remain strong. As long as virgin PET continues to be produced at a low price, producers will find a way to use it in single-use products, even outside the PET bottle market. Increasing the amount of recycled content in PET bottles without turning off the tap for virgin PET production will simply continue to increase the total amount of PET in circulation. Plastic production is expected to triple by 2050,51 resulting in more and more material entering a system that was not designed with long-term circularity in mind.
Recent deep-dives into the history of the plastics industry have uncovered that plastics were never designed to be recycled at scale.52 As mentioned above, the key challenge lies in the economics: new plastic, made from oil and gas, is almost always less expensive and of better quality than recycled plastic. Plastic recycling initiatives and anti-littering campaigns were originally created by oil and petrochemical industries to divert attention away from plastic pollution and to improve the public image of plastics, rather than providing economically viable solutions for plastic recycling that can compete with virgin plastic production.
While chemical recycling technologies have the potential to overcome PET mechanical recycling limitations, further research needs to be done to fully understand whether the increased energy demand and emissions associated with chemical recycling will outweigh the environmental savings from a life cycle perspective. In addition, these technologies require additional time and investments to reach scale.53
47 FDA. (2018). 48 According to the “Breaking the Plastic Wave” report released by Systemiq (2020), chemical recycling of plastics has not yet been proven at scale, and has higher costs and emissions compared to mechanical recycling. This highlights the importance of decarbonizing energy sources alongside investments in scaling up chemical recycling technologies. 49 Wenzel, E. (May 22, 2020). 50 Nuccitelli, D. (July 30, 2018). 51 Sullivan, L. (September 11, 2020). 52 See the NPR article “How Big Oil Misled The Public Into Believing Plastic Would Be Recycled” for more information (Sullivan, 2020). 53 Kersten-Johnston et al. (2019).
02 Production
Where are the largest energy, water, and greenhouse gas (GHG) emissions occurring in the production of these packaging types, and to what extent will recycling reduce these impacts?
Let’s now take a look at the main environmental impacts of each material’s production system. We scaled environmental impacts across the product’s life cycle to see where the largest energy, water, and GHG emissions are occurring. By mapping out these material and energy flows, we can identify the key impact areas associated with production of each packaging type. This information can be used to better understand the environmental claims associated with recycling these packaging materials.
Our assessment is based on a functional unit of providing 1000 liters (L) of beverage in 12-oz containers produced in North America. The use phase has been excluded from the scope of this assessment, and we’ve only included the base material in the analysis for each packaging type (aluminum, glass, and PET). We’ve included a sensitivity analysis for different container sizes and densities in Appendix 1.
Note: See Appendix 1 for our full impact assessment model assumptions and references. Our analysis was based on life cycle assessment methodology, and we used key model assumptions from existing LCA reports, but it is not a full ISO 14040 LCA. Results are intended to show where the relative impacts are occurring across each packaging production system and should only be interpreted using the assumptions built into our model.
For a recent ISO 14040 LCA which compares impacts across different packaging materials and sizes, see the Ball Corporation Life Cycle Analysis completed in 2020 by Sphera, available here.
A note on impact assessment methodologies
Life cycle assessments typically follow one of two methods to calculate the impacts of a system: the recycled content approach and the avoided burden approach.
The recycled content approach
In the recycled content approach, also known as a cut-off approach, the amount of secondary material used in a product is considered to be free of primary material environmental impacts, but it does include impacts associated with transporting and processing the recycled content for use in the product system. The remaining primary materials contain upstream impacts associated with raw material extraction and processing. The system is cut-off at a product’s end-of-life, which means the credits for continued material recycling are excluded from the assessment. When using a cut-off approach, the recycled content is a key variable in determining the life cycle impacts of a product.
The avoided burden approach
In the avoided burden approach, the end-of-life recycling rate becomes a key variable in determining life cycle impacts of a product. Rather than reducing impacts based on the recycled content of a product, credits are given for the amount of material recycled at the product’s end-of-life. These secondary recycled materials are assumed to displace primary materials used in a new product system, with impact reduction credits – as well as the associated impacts from recycling – applied to the original product system.54
We’ve used both the recycled content and avoided burden approaches for our analysis. The results in Chapter 2 correspond to the recycled content approach, with high-level results from both calculation methods highlighted in Figures 5-7. See Appendix 1 for full model results using both approaches.
54 See Nordelöf et al. (2019) for a clear comparison of these two life cycle modelling approaches using lithium-ion battery recycling as the case study.
Aluminum cans
Introduction
Primary aluminum production has high environmental impacts compared to secondary aluminum production, which is why setting up robust systems for high-value material recovery is so important. Since producing secondary aluminum requires 90-95% less energy compared to virgin aluminum production, the high recycled content in aluminum cans greatly reduces an average can’s environmental impact.
Since producing secondary aluminum requires 90-95% less energy compared to virgin aluminum production, the high recycled content in aluminum cans greatly reduces an average can’s environmental impact.
As with any recycled material, the benefits of displaced primary aluminum should outweigh the life cycle costs associated with collecting, processing, and transporting secondary materials for reprocessing, which we explore further for each material type in Chapter 4.
See Figure 5 to explore the energy, water, and GHG emissions linked to each stage of the aluminum can life cycle. The width of each line represents the percentage of the impact that corresponds to each stage.

Functional Unit: Provision of 1000L of beverage in 12-oz cans, 0.01334 kg per can, 73% recycled content (recycled content approach), 49.8% recycling rate (avoided burden approach). Use phase excluded from scope of this assessment.
Aluminum Can Life Cycle Hotspots
Raw Material Extraction
While bauxite mining itself does not require high energy inputs, the strip mining process can lead to wildlife habitat destruction, polluted waterways, and soil erosion, impacting human health and biodiversity.55 The aluminum industry has developed guidelines to minimize these impacts,56 and aluminum producers should monitor their upstream suppliers to ensure proper standards are being met. Bauxite was added to the European Commission’s Critical Raw Materials list in 2020,57 which further highlights the importance of sourcing recycled aluminum for continued high-value circulation.
Distribution
Most bauxite used for aluminum production in the United States is imported from Jamaica and Brazil, which is responsible for 20% of the transportation-related emissions in our model.
Production
The most significant energy, water, and GHG impacts in the aluminum system occur in the production phase, which involves transforming bauxite ore into usable aluminum ingot. This includes both alumina production and aluminum refining, with most impacts linked to refining.
The water depletion associated with the production stage of aluminum cans is linked to the hydropower energy demand in the system, rather than to direct water withdrawals. In the United States, 74% of electricity used for aluminum production comes from hydropower, which is connected to increased water evaporation from reservoirs.58 This burden shift between water, energy, and emissions is further explored in Table 1.
Refining
Electrolysis, used in the reduction of pure alumina in the aluminum smelting and refining process, has the most impacts of any stage across the aluminum can life cycle. This process is responsible for 34% of the cumulative energy demand for all industrial processes in this system, which is especially high considering over two-thirds of the can is manufactured using secondary materials in our model. These impacts are also highly dependent on the electricity fuel mix of the producing country – not all primary aluminum is created equal.58
Can Manufacturing
Can manufacturing includes several processes such as forming, ironing, pressing, trimming, and coating. The electricity and heat needed throughout these processes, coupled with the production of lubricant oil, coatings, inks, and solvents, drive the environmental impacts in this life cycle stage.
Treatment and Recycling
The collection, sorting, cleaning, and recycling process requires a fraction of the environmental costs associated with producing virgin aluminum.
55 Gitlitz, J. (2002). 56 IAI. (2018). In addition, the Aluminum Stewardship Initiative has outlined standards related to primary aluminum production. Retrieved from https://aluminium-stewardship.org/asi-standards/ 57 Bloxsome, N. (September 4, 2020). Bauxite recognised as ‘critical raw material.’ Retrieved from https://aluminiumtoday.com/news/bauxite-recognised-as-critical-raw-material 58 McMillan, C.A., & Keoleian, G.A. (2009). 59 Buxmann et al. (2016).
Key Model Assumption: Energy Grid
The production-related water consumption impacts in the aluminum can system come from the use of hydroelectric power. When changing the model inputs from the hydroelectric industry-specific data to match the average U.S. electricity grid, the environmental impacts across these three categories change significantly, as seen in Table 1.

Impact results rounded to the nearest 5.
GWP = Global Warming Potential CED = Cumulative Energy Demand WDP = Water Depletion Potential
This represents a textbook example of burden shifting between energy, water, and GHG emissions. Switching to U.S. grid electricity drives an increase in GHG-related emissions and energy demand by around 40%, while the water consumption (primarily linked to hydropower) decreases by 64%, displaying, as a result, similar levels of water depletion when compared to the other packaging types.
Glass bottles
Introduction
When examining the life cycle impacts of glass bottle production, an overwhelming concentration of energy and GHG impacts are seen in the manufacturing phase, largely due to the high amount of energy used for melting glass. The higher weight of glass also corresponds with increased transportation emissions from distribution.

Functional Unit: Provision of 1000L beverage in 12-oz bottles, 0.20034 kg per bottle, 27.5% recycled content (recycled content approach), 42% recycling rate (avoided burden approach). Use phase excluded from the scope of this assessment.
Glass Bottle Life Cycle Hotspots
Raw Material Extraction
Glass is mainly made from limestone, silica sand, soda ash, and feldspar. These can all be sourced within the United States, reducing upstream transportation emissions and minimizing critical raw material risks.
Furnace Impacts
The high intensity of natural gas and fuel oil used in glass furnaces account for 82% of the total GHG emissions and 79% of the total cumulative energy demand in the system. These furnaces run constantly for approximately 15-18 years without stopping or cooling down.60 Energy-saving strategies can only be implemented at the end of a furnace’s lifetime, representing a technological lock-in within the glass manufacturing system.
Bottle Manufacturing
Other steps in the glass bottle manufacturing process include batch preparation, melting processes, and final conditioning61 and forming of glass containers to meet production requirements.
Distribution
While the raw materials for glass production and manufactured bottles display shorter shipment distances (on average) when compared to aluminum and PET, the total mass of materials shipped per mile is significantly higher, resulting in comparatively higher transportation impacts.
Recycled Content
Every 1% of recycled glass cullet added to primary glass results in a 0.4% reduction in energy requirements in the manufacturing stage.62 Since the majority of impacts occur in glass manufacturing, the life cycle environmental savings associated with glass recycling are actually quite low, as further explored in Figure 8.
Water Impacts
Since glass manufacturing does not rely on hydroelectric power, the main life cycle water impacts come from indirect water use associated with the transportation and distribution sector that are not directly related to glass production.
60 AGC Glass Europe. (2020). 61 Glass bottle conditioning refers to the process of reheating and slowly cooling bottles once they are blown to strengthen the glass and reduce breakage. 62 This energy reduction rate was used in the LCA model, based on the life cycle inventory data in RTI International. (2003). The assessment performed by RTI uses industry-specific sources. This is a high-end estimate, as several other sources say a 10% increase of glass cullet reduces glass manufacturing energy consumption by 2-3%: Testa et al. (2017).; Papadogeorgos, I., & Schure, K.M. (2019).
PET bottles
Introduction
Most environmental impacts in the life cycle of PET bottle production occur in the raw material extraction and resin production phase, with the second highest impacts in the manufacturing stage. See Figure 7 for a breakdown of where the main energy, water, and emissions come from in our model.

Functional Unit: Provision of 1000L beverage in 12-oz bottles, 0.019 kg per bottle, 6% recycled content (recycled content approach), 29% recycling rate (avoided burden approach). Use phase excluded from the scope of this assessment.
PET Bottle Life Cycle Hotspots
Raw Material Extrac-tion AND Production
The initial raw material extraction and resin production stage has the highest life cycle impacts, making up 52% of the total GHG emissions and 60% of total energy demand. This includes impacts associated with crude oil and natural gas extraction to the polymerization of the plastic monomer.63
Bottle Manufacturing
PET bottles are created through an injection molding process and subsequent heating and stretching with high-pressure air blows to produce large volumes of bottles with high precision. The electricity requirements of these molding processes, particularly stretch blow molding, explain the relatively high environmental impacts associated with this life cycle stage.
Water Use
While some water is directly used in the PET recycling process, the majority of the water impacts from our model are indirectly linked to upstream activities connected to electricity generation.
Recycled PET Impacts
Using recycled PET bypasses the impacts associated with raw material extraction and resin production. However, the manufacturing impacts for injection and blow molding remain the same.
63 These processes are all aggregated together in Ecoinvent life cycle data, which we used for our analysis. LCA practitioners have pointed out the general lack of data per life cycle step regarding PET, which hampers the robustness and reliability of many life cycle assessments. Refer to Gomes et al. (2019).
Key Model Assumption: Recycled Content
In many cases, the production of secondary material results in fewer impacts compared to the production and manufacturing of virgin materials, since secondary materials can bypass the upstream environmental impacts of raw material production. We tested our model using different recycled content ratios for each packaging type, revealing differences in environmental impacts with different amounts of recycled content.

Life cycle impacts for the provision of 1000L beverage in 12-oz bottles
GWP = Global Warming Potential | CED = Cumulative Energy Demand | WDP = Water Depletion Potential
From Figure 8, we see that aluminum cans show the greatest impact variability when recycled content assumptions are modified in our model. This is because the relative impact savings between producing primary and secondary materials in the aluminum system are much higher than the impact savings of increasing recycled content for the other packaging types. When compared to primary aluminum, recycled aluminum has a 93% reduction in the overall GHG emissions and respective 92% and 86% reductions in renewable and fossil-based energy demand, resulting in significant impact differences when the recycled content assumptions change.
Glass and PET bottles tell very different stories. For PET bottles, we see a consistent reduction of environmental impacts for GHG emissions and energy demand, but small reductions for water consumption. For glass bottles, the increased use of glass cullet in the manufacturing of containers displays relatively low environmental benefits, since the high energy demand linked to the manufacturing phase – the most burdensome life cycle stage in glassmaking – decreases marginally when using recycled glass cullet compared to virgin glass. As mentioned previously, for every 1% of cullet added to primary glass, only a 0.4% reduction in energy requirements in the manufacturing stage is reached.64 Furthermore, the energy reduction impact of increased recycled glass cullet is largely overshadowed by the increased emissions associated with transporting recycled cullet back to furnaces for remelting.65
This reaffirms the importance of setting up local processing and reuse options for glass bottles. By extending the lifespan of glass bottles and circulating the packaging material at its highest and best value, the burdens of glassmaking are able to be distributed through several use phases based on its “return” or “trippage” rate. According to an LCA study comparing carbonated soft drinks in the U.K.,66 a 0.75L glass bottle trippage rate of 3 cycles has the potential to equalize the impacts associated with glass manufacturing compared to 0.33L aluminum cans and 0.5L PET bottles. Although this estimation may be different for the U.S. system, where the distribution distances are vastly larger than those in European countries, reusability seems by far the most effective circular strategy to attain environmental savings for glass bottles.
While increasing the amount of recycled glass cullet in glass containers can have life cycle benefits from reducing primary material demand and reducing glass manufacturing impacts, it is a suboptimal circular strategy that plays at the margins of the true circular potential for glass: reuse.
Recycling glass is a suboptimal circular strategy that plays at the margins of the true circular potential for glass: reuse.
The challenge will be for glass packaging manufacturers and beverage producers to set up localized glass bottle collection, sterilization, and reuse systems that can minimize the transportation and distribution impacts of transporting empty glass bottles. Once glass bottles can no longer be reused, these materials can be collected for recycling and turned back into new glass bottles – ideally collected separately from other materials to minimize risk and contamination of broken glass in the sorting process. A combination of reuse and recycling of glass will maximize the impact reduction potential and minimize raw material demand in a fully circular beverage container system.
64 As noted, this is a high-end energy savings estimate based on glass life cycle inventory data (RTI International, 2003). Other sources cite 2-3% energy savings for every 10% of extra cullet added to the glass manufacturing process. Testa et al. (2017).; Papadogeorgos, I. & Schure, K.M. (2019). 65 Our model assumes an equal 500-mile transportation distance from the treatment facilities where the packaging materials are recovered and subsequently distributed back for remanufacturing for all packaging types. Glass cullet that is transported less than 500 miles will likely see marginal improvements in life cycle emissions impacts, which highlights the importance of localized strategies for material recovery. 66 Amienyo et al. (2013)

03 U.S. Recycling System Assessment
Now that we’ve assessed the design considerations and production impacts of these beverage containers, let’s see how each of these materials is currently being handled in the U.S. waste management system.
How are these packaging types currently being collected and processed in the U.S. recycling system, and what are the barriers to achieving a reliable stream of recycled materials that can compete with raw material production?
The recycling process in the United States is complex, with each state and municipality having a different system to collect, sort, and process recyclable materials. Some municipalities have curbside collection of recyclables, either through single-stream or multi-stream collection systems.67 While single-stream systems are easier for households to put all recyclable materials in one bin, these systems typically have higher contamination rates compared to multi-stream separate collection systems. Municipalities in rural areas usually rely on drop-off services to collect recyclable materials for reprocessing. According to the 2020 State of Curbside Recycling Report,68 59% of U.S. households have access to curbside recycling services, and only 6% of households do not have access to any recycling services (Figure 9). However, having access to recycling services does not directly correlate with actual material collection rates, which underscores the importance of providing convenient and incentive-based recycling systems for consumers.

Collection rates of different material types differ state-by-state, particularly for aluminum cans, PET bottles, and glass bottles. Ten states have implemented bottle bill policies, which put a 5- to 15-cent deposit on beverage containers. Customers receive this deposit back when they return cans and bottles to redemption centers. This provides an economic incentive for increased recycling, and it also creates cleaner recycling streams compared to single-stream recycling systems. The Container Recycling Institute estimates that these bottle bill states are responsible for recycling 46% of all containers,69 while only making up around a quarter of the U.S. population. It’s clear these bottle bill redemption states are an important source of high-quality recycled beverage container materials.
Visualizing Material Flows
One way to better understand how each of these materials is currently being handled in the U.S. waste and recycling system is to assess and visualize each step of the process in a material flow analysis (MFA). Our beverage container MFA draws on data from 2017, since this was the most recent year with publicly available data for all three packaging types.70 Figure 10 shows the MFA results scaled to 100% for each packaging type, which allows us to compare material recovery rates across the different material types. Figure 11 shows the same data scaled to the market mass for each packaging type, which allows us to compare the actual amount of material being collected and processed in the system. You can read the MFA from left to right to track each beverage container as it progresses through the system, from collection and sorting through processing materials for recovery.
In our assessment, we’ve split the collected materials into two groups: 1) materials collected through the bottle bill deposit system, and 2) materials collected separately from trash (referred to as “separately collected materials” in this report), which groups together all other methods of collection for recycling. For this model, we’ve treated all the separately collected materials as if they were collected and sorted in a single-stream recycling system, as this is the most common collection method for U.S. municipalities. Full MFA assumptions and sources are referenced in Appendix 2.
67 Damgacioglu et al. (2018). 68 Mouw et al. (2020). 69 The Container Recycling Institute. (2020). 70 We based our analysis on the industry-reported material generation and recycling rates according to the U.S. EPA for each packaging type in 2017. The glass container mass was adjusted to remove glass food packaging, using shipping report data from the Glass Packaging Institute.


Unit: million pounds of material.
Putting Recycling Rates in Context
We used the industry-reported recycling rates for each beverage container as the starting point in our analysis.71 In 2017, these recycling rates were 45.1% for aluminum cans, 39% for glass bottles, and 29.1% for PET bottles.72 However, just looking at recycling rates doesn’t tell the full story of the recycling system. It’s also important to see how much material is being lost in the sorting and recycling process, and to better understand whether the materials are being processed in a way that allows for materials to be used in high-quality secondary material markets to maximize impact reduction potential and compete with primary material production.
The aluminum can recycling rate refers to the amount of shredded used beverage cans (UBCs) that are ready for remelting – shown in the MFA under the “processed materials” category. In comparison, the glass and PET recycling rates are reported as the amount of sorted material ready for processing, shown under “sorted materials.” Already, we see that the material recycling rates don’t show the full picture, as one-third of PET material is lost in the mechanical recycling process, and 40% of the glass material collected from single-stream recycling systems is used as landfill cover.73 Neither of these material losses are accounted for in the reported recycling rates, which do not factor in the efficiency of recycling or whether recycled materials are used for high-value applications. This highlights the importance of assessing recycling rates from a full systems perspective.

71 Industry-reported recycling rates refer to the recycling rates submitted to the EPA by the Aluminum Association, Glass Packaging Institute, and NAPCOR each year. 72 While 2017 represents a lower than normal consumer recycling rate for aluminum cans at 45.1%, this was the most recent year where both glass and PET data are also publicly reported by industry groups to the EPA. 73 NAPCOR & APR. (2018).; Damgacioglu et al. (2018)

Aluminum Can Recycling Insights
Of the three material types, aluminum cans have the highest circular performance in the current U.S. recycling system. When considering sorting and processing losses, nearly 82% of UBCs entering the U.S. recycling system can be recovered for high-quality closed-loop recycling.74 In addition, some UBC material is captured after incineration, adding an additional 132 million pounds of material (5% of total aluminum can production) to the open-loop recycling market each year.75

Once cans enter the recycling system, the largest material losses occur in the sorting stage at material recovery facilities (MRFs), where up to 25% of UBCs can be missorted into other material streams or lost in the sorting process.76 Some facilities and downstream recyclers have additional eddy currents installed to capture this lost value from missorted UBCs, which represent one of the most valuable commodities in the recycling system. In fact, while UBCs only represent about 2% of material coming into sorting facilities by weight, aluminum cans represent nearly a third of MRF revenues in non-deposit states. The revenue from UBCs is vital for many MRFs in the United States to operate.77
While the sorting efficiency for UBCs is lower than the other material types, the purity of sorted UBC bales is relatively high (around 91%),78 which means the material bales can be sold and reprocessed at a high value. According to the Container Recycling Institute, around 40% of recycled UBCs are collected through bottle bill deposit systems,79 which are pure material streams that bypass the sorting phase. Once collected and sorted, UBCs are shredded at nearly 99% efficiency and are remelted at a 95.6% efficiency.80
Glass Bottle Recycling Insights
When factoring in sorting and processing losses, an estimated 59% of glass collected in the U.S. recycling system (from both deposit and non-deposit sources) can be turned back into glass bottles for closed-loop recycling.81
In 2017, the glass bottle recycling rate was reported at 39%, which represents the total amount of glass available through both bottle deposit and separate collection systems. These two different collection methods result in vastly different material quality streams for glass. 97% of the glass recovered through bottle deposit systems can be used for high-quality purposes, whereas on average only 40% of the glass collected in single-stream recycling systems is recovered for high-value reuse. Of the remaining glass collected in single-stream recycling, 40% is typically used as landfill cover and 20% is downcycled as an additive in construction processes.82 Downcycled glass used in construction will be impossible to recover again for continued high value reuse. High-quality sorted glass, which primarily comes from deposit systems, can be turned back into glass cullet for continued use in glass bottles or fiberglass at a 90% processing efficiency.83

Collecting and sorting glass is particularly difficult in single-stream recycling systems, since broken glass can damage machinery and small pieces can contaminate other recycling streams.84 In addition, while the glass breaker screen is 95% efficient at separating out glass in the sorting process, the purity of sorted mixed glass is only around 70%.85 This high amount of contamination, combined with the high cost of transporting glass, means MRFs often lose money from collecting and processing glass for recycling.86
These difficulties associated with glass recycling further highlight the importance of prioritizing localized and robust systems for glass bottle reuse. Reuse systems are the best way to maximize the true circular potential of glass bottles, as long as the system is designed in a way to minimize emissions from transportation and distribution logistics.
PET Recycling Insights
The 2017 recycling rate for PET bottles was reported at 29.2%,87 representing the total amount of PET available for processing after collection and sorting. Since PET is processed into rPET at 67% efficiency,88 the actual amount of rPET flakes available for open- and closed-loop recycling is around 20% of the total market mass, or 1,160 million pounds. Of this material, 21% is used for food-grade purposes, and the remaining 79% is used for other non-food grade applications, with most being used to create polyester fibers for clothing. While these open-loop material uses for rPET can reduce demand for primary PET in the short term, products such as fibers and films are less likely to be recycled at the end of their useful life compared to PET bottles, resulting in a linear system in the long term.

According to the Container Recycling Institute, an estimated 55.5% of PET bottles are collected via deposit systems,89 and the remainder are separately collected. When accounting for the 85% sorting efficiency for PET bottles at MRFs, along with the 67% processing efficiency from the recycling process, an estimated 13% of collected PET is used for food grade applications.90
Deposit systems are the best way to ensure PET can continue to be used in closed-loop food grade applications and generate enough market mass to meet recycled content goals. In states that do not have bottle bill legislation, the PET recycling rate hovers around 14%. In comparison, states that have enacted bottle bill legislation have a PET recycling rate of around 60%.91 It’s clear that bottle bill systems work – by putting value on what many consider waste, consumers have an incentive to collect and return materials for continuous circulation. That’s the best way recycled PET bottles can circulate at their highest and best use while amassing enough material to compete with virgin PET production.
Setting up a bottle bill system across the country would improve recycling rates for the other container types as well. Glass bottle recycling increases from 14% in non-deposit states to nearly 65% in deposit states.92 Aluminum can recycling rates jump from 35% to over 76%. But in terms of high-quality material recovery, PET bottles benefit the most, since bottle bill deposit systems provide a trackable source of verified food-grade PET bottles that can continue to be circulated at their highest and best use, rather than entering the general recycling system to be recycled one more time before ultimately being disposed of.
74 Calculated from the MFA: Recycled aluminum ingot mass (1150 MMlbs) divided by the mass of aluminum collected in deposit and separate collection systems (488+915 MMlbs). 75 Based on our conversations with aluminum can manufacturers and our literature scan, aluminum recovered from incineration is less likely to be used as recycled content for aluminum cans and is more likely to be used in other cast alloy aluminum applications. Gökelma et al. (2019).; Allegrini et al. (2015).76 See the 2020 Gershman, Brickner, and Bratton (GBB) report for a full analysis of where and how aluminum cans are lost in the material recovery process. Simmons, S. (2020). 77 Ibid. 78 Damgacioglu et al. (2018). 79 The Container Recycling Institute. (2020). 80 PE Americas. (2010b). 81 Calculated from the MFA: Glass cullet mass (3460 MMlbs) divided by the mass of glass collected in deposit and separate collection systems (2730+3150 MMlbs). 82 Gitlitz, J. (2013).; Majdinasab, A., & Yuan, Q. (2019).; Damgacioglu, H., Perez, L., & Celik, N. (2018). 83 Franklin Associates. (2018b). 84 Damgacioglu et al. (2018). 85 Ibid. 86 Jacoby, M. (February 11, 2019). 86 Jacoby, M. (February 11, 2019). 87 NAPCOR & APR. (2018). 88 Ibid. 89 The Container Recycling Institute. (2020). 90 Calculated from the MFA: Food grade rPET flakes (244 MMlbs) divided by the mass of PET collected in deposit and separate collection systems (1030+829 MMlbs). 91 The Container Recycling Institute. (2020). 92 Ibid.
04 Intervention Scenarios
How does each packaging type respond to key system interventions within the U.S. recycling system?
After examining the U.S. recycling system in detail, we identified three key system interventions, or leverage points, that have the potential to move the system towards a more circular and sustainable state.
1. Technology
Sorting scenario: Increase sorting efficiencies to improve material recovery yields (reaching 100% sorting efficiency by 2040)
2. Behavior
Collection scenario: Increase collection of materials through existing curbside recycling infrastructure (reaching 100% collection by 2040 through existing systems)
3. Policy
Bottle bill scenario: Implement a national bottle bill to increase material collection and improve the quality of material streams (reaching 100% collection by 2040 through deposit systems)
We created a dynamic model for each of the different packaging types, using the MFA assumptions as a baseline scenario. For this assessment, we kept the market mass for each material type constant to focus on the effect of these interventions rather than market trends. We then modeled the effects of each scenario on each of the packaging systems over time, keeping track of the point where the closed-loop recycled content “saturation point” is met for each material type (90% for aluminum and glass, 43% for co-collected PET and 72% for mono-collected PET). When material recovery rates increase beyond this point, we assume materials will be used for open-loop applications. Through this exercise, we can see which intervention points have the most potential to improve circularity and material recovery for each packaging type and also calculate potential environmental savings for each intervention. We’ve highlighted some key findings from our analysis here, but refer to Appendix 3 for full model assumptions and results.
Key Results:
- The improved sorting scenario moderately increases the amount of aluminum material available for recovery (11%) but shows minimal improvements for PET (2%) and glass (1%). This highlights the importance of prioritizing increased material collection in combination with making the existing system more efficient – particularly through installing additional eddy current separators.
- In the collection scenario, much of the environmental savings from increased PET and glass collection from curbside systems are largely cancelled out by increased reverse logistics and transportation-related impacts. While increased curbside collection shows marginal improvements for PET open-loop recycling, the bottle bill scenario provides environmental benefits for the PET closed-loop system because cleaner material streams allow for a higher PET recycled content. Environmental savings for glass are only seen in the bottle bill scenario, but these impact savings are marginal compared to the other material types. Aluminum cans show positive environmental savings from both increased collection and bottle deposit systems.
- Aluminum cans have the highest impact reduction potential across all three scenarios compared to the other packaging types, with the bottle bill scenario providing the largest material recovery and impact reduction potential for both open- and closed-loop markets.
- The bottle bill scenario provides the largest potential for high value material recovery and maximum impact reduction for all packaging types, providing materials for both open-loop and closed-loop recycling. However, given the high transportation and energy requirements for glass recycling, the best option for glass would be to integrate a local reuse model through the bottle deposit system.
Dynamic Model Results: Aluminum Cans
Closed-loop saturation point: 90% recycled content
Current recycled content: 73%

The bottle bill scenario provides an increase of 44% more material recovered within 30 years, compared to 29% for the collection scenario, and 11% for the sorting scenario. The reference scenario is the business-as-usual baseline with no changes to the current system.
The bottle bill scenario leads to the highest amount of total aluminum recovered for recycling, reducing the amount of aluminum recovered from incineration and the amount of landfilled aluminum due to a strong increase in high-quality collection with minimal sorting losses. When the overall collection rate amounts to 73% (once deposit rates increase from 18% to 43%, plus an additional 30% from separate collection) enough beverage cans are recovered to reach the 90% recycled content ceiling for beverage can production – assuming the recycled content from post-industrial sources remains constant over time.
Impact Reduction Potential
The bottle bill scenario has the potential to achieve a 35% reduction in emissions for the aluminum closed-loop system, shown in Figure 14. When deposit rates exceed the closed-loop potential, increased amounts of additional high-quality material become available to other markets, also allowing for potential to displace primary aluminum in other material systems. The amount of potential impact reduction that could be enabled in other product systems is shown in the bottom half of Figure 14, representing an additional 60% reduction in global warming potential (GWP) that could benefit other product systems.

Note: We’ve constructed the dynamic model for the closed-loop system using a recycled content cut-off approach. Therefore, it is not allowed to double count the benefits of the extra available secondary materials used for open-loop recycling within the beverage container production system. However, in order to show the magnitude of potential impact reduction from a system-wide perspective, we’ve presented the open-loop recycling impact reduction results in addition to the closed-loop results, as a hybrid approach to expand the system. Open-loop benefits can be referred to as “the amount of potential impact reduction that could be enabled in other product systems,” but in this case should not be used as “avoided burdens” within the product system or assert that the material system is “net zero” or similar claims.
Dynamic Model Results: Glass Bottles
Closed-loop saturation point: 90% recycled content
Current recycled content: 27.5%

The bottle bill scenario provides an increase of 73% more material recovery within 30 years, compared to 49% for the collection scenario, and less than 1% for the sorting scenario.
Increases in sorting and collection do not achieve the saturation point for a closed-loop system. Only with increased deposits under a national bottle bill scenario does the glass material system sustain its own supply of secondary raw materials, once deposit rates reach 79% (in addition to the material being collected through separate collection systems,93 resulting in 91% total collection). Increased deposits are linked to decreased glass fines94 for open-loop recycling and reduced landfilled and incinerated glass.
As seen in Figure 16, the environmental benefits from increased collection are minimal, primarily due to the relatively low life-cycle energy savings from glass recovery and the high emissions associated with transportation.
93 In our model, separate collection rates decrease over time as deposit rates increase. 94 Glass fines are small glass particles that are crushed in the recycling process and can no longer be recovered for glass bottle remanufacturing.

Dynamic Model Results: PET Bottles
Closed-loop saturation point: 72% recycled content
Current recycled content: 6%

The bottle bill scenario suggests an increase of 113% more material recovery within 30 years, compared to 63% for the collection scenario, and 2% for the sorting scenario.
Only high deposit rates allow for the PET material system to sustain its own supply of secondary material. Once the deposit rate increases from 17% to 83%, the PET bottle material system produces enough food-grade rPET to reach its recycled content limit, and the ceiling for closed-loop recycling is reached.
Sensitivity Analysis: PET Recycled Content Limit
A key assumption in the PET system is the recycled content limit, which is linked to the purity of the material collection system. Studies show that a cleaner waste stream, combined with more lenient critical threshold requirements for contaminants, results in a higher acceptable level of recycled content for PET in a closed-loop system.95 To quantify the sensitivity of these assumptions, we ran our model under three scenarios. The baseline scenario uses a midpoint recycled content limit of 43% for co-collection systems and 73% for deposit systems. We also ran the model with ‘strict’ recycled content ceilings (51% limit for deposit streams, 16-37% for co-collection systems depending on the purity of the co-collection stream) and ‘lenient’ recycled content ceilings (93% limit for deposit systems, 43-83% for co-collection systems depending on the purity of the co-collection stream). For the collection and sorting scenarios, the amount of recovered PET does not reach the recycled content ceiling, so the strict or lenient scenarios do not impact our results. However, in the bottle bill scenario, the effects are noticeable: adhering to strict recycled content limits would reduce the amount of closed-loop PET by 12%, and adhering to lenient limits would increase the amount of closed-loop PET by 6%.
Still, the bottle bill scenario shows the biggest potential for displacing primary material, and it shows the largest potential for reducing PET sent to landfills and incineration. Increased deposit practices actually reduce the amount of low-quality PET available in the expanded system, but increase the amount of higher quality available in the PET material system, once the closed-loop recycled content limit for PET bottles is reached.

Comparative Results
When comparing impact reduction across all material types for each scenario, a few key insights jump out. Aluminum cans are the only packaging material that show life cycle environmental improvements across all indicators and scenarios, both for closed-loop and open-loop recycling (Tables 2 and 3). This is because the impact savings of recycling aluminum far outweigh the costs of primary aluminum production, and once the material is collected, aluminum has minimal processing losses – allowing for a high potential for material displacement over multiple recycling loops. Even when the aluminum can production system reaches its closed-loop recycled content limit, the open-loop recycled material continues to benefit aluminum produced for other uses, highlighted in Table 3.
For PET bottles, increasing collection rates through existing infrastructure without processing improvements shows that large amounts of PET will become available for open-loop recovery, but only a small proportion of this recovered PET will be used to displace food-grade primary PET. Furthermore, the increased impacts of collecting, sorting, and processing PET for closed-loop mechanical recycling largely negate the benefits from displacing primary PET in bottle production (Table 2). The increased collection scenario adds additional sources of non-food-grade rPET to the system, where it can reduce environmental impacts through open-loop recycling (i.e. displacing virgin PET used in fleece production). However, the best impact reduction scenario for PET bottles is to expand collection through a bottle bill deposit system, which provides the cleanest material stream for closed-loop recycling with the highest environmental impact reduction potential.
Similarly, the environmental and energy savings associated with increased glass recycling are largely outweighed by the increased environmental costs of transporting and processing collected glass for recycling. In our model, the manufacturing of glass bottles using glass cullet requires slightly less cumulative energy demand compared to processing virgin glass. From a full life cycle perspective, these environmental savings are only seen in the bottle bill collection scenario, where a much higher percentage of high-quality glass can be recovered to balance out the increased transportation and processing costs of recycling. In markets where glass recycling facilities are close to remanufacturing sites, the life cycle environmental savings for glass recycling will have better results. Overall, the environmental savings for glass recycling are minimal compared to the other packaging types, which highlights the importance of glass reuse to maximize impact reduction potential in a circular packaging system.

[% change from 2020 baseline]
GWP = Global Warming Potential; WDP = Water Depletion Potential; CED = Cumulative Energy Demand

[% change from 2020 baseline]
GWP = Global Warming Potential; WDP = Water Depletion Potential; CED = Cumulative Energy Demand
The Bottle Bill Scenario has been outlined to highlight its improved potential in reducing environmental impacts compared to improved collection and sorting interventions in all three packaging systems. See Appendix 3 for additional results and interpretation from our dynamic model for each scenario and material type.
Similarly, the environmental and energy savings associated with increased glass recycling are largely outweighed by the increased environmental costs of transporting and processing collected glass for recycling. In our model, the manufacturing of glass bottles using glass cullet requires slightly less cumulative energy demand compared to processing virgin glass. From a full life cycle perspective, these environmental savings are only seen in the bottle bill collection scenario, where a much higher percentage of high-quality glass can be recovered to balance out the increased transportation and processing costs of recycling. In markets where glass recycling facilities are close to remanufacturing sites, the life cycle environmental savings for glass recycling will have better results. Overall, the environmental savings for glass recycling are minimal compared to the other packaging types, which highlights the importance of glass reuse to maximize impact reduction potential in a circular packaging system.

We can also explore the results of our dynamic model by comparing the impact reduction potential per unit of material recycled across the different packaging types. Since the bottle bill system is the only scenario that shows positive results across all packaging materials, we’ve calculated the emission reductions per metric ton of material recovered as deposit collection increases over time in Figure 19. The dots represent the closed-loop impact reduction potential and the crosses represent the combined open- and closed-loop impact reduction potential. We calculated life cycle emission reductions each year compared to the 2020 scenario baseline.
Once the closed-loop limit is reached (for example, once aluminum cans reach their 90% recycled content limit around year 2027), the system-wide emission savings still continue to increase. However, since the environmental benefits of recycling can no longer be counted towards the closed-loop system beyond this point, the impact savings per unit collected gradually decrease due to the increased material collection, transportation, and processing costs without the associated primary material displacement benefits in the closed-loop system. This highlights the importance of considering emission reduction potential from a system-wide perspective, rather than only looking at closed-loop recycling benefits. Collecting and recycling aluminum cans has the largest system-wide impact reduction potential of all three material types.
By linking our dynamic model with environmental impacts across the production chain, we can see that the life cycle impact reduction potential of collecting and recycling more aluminum cans far outweighs the impact reduction potential of collecting and recycling PET and glass bottles. In 2040, once a 100% deposit collection rate is achieved, the total emissions impact reduction potential for recovering one metric ton of aluminum cans is 3 times higher than PET bottles and 42 times higher than glass bottles. Not only are aluminum cans the most valuable of the three materials from an economic perspective, but they are also the most valuable to recycle from a CO2e impact reduction perspective. This underscores the importance of ensuring all aluminum cans are collected for high-value recovery, so that these materials can continue to circulate within our economy.
In our model, as deposit collection rates gradually increase to 100% by 2040, recycling additional aluminum cans saves on average 4.3 metric tons of CO2e per ton of material collected, considering both open- and closed-loop recycling. This is equivalent to the emissions from burning nearly 500 gallons of gasoline or charging over 500,000 smartphones per metric ton of aluminum cans recycled.96 When compared to the 2020 baseline, the impact of recycling 100% of aluminum cans has the potential to save an additional 6 million metric tons of CO2e each year – the equivalent to the annual emissions from electricity used in over 1 million U.S. homes.
To put the quantity of increased UBC collection in perspective, doubling the current annual collection rate of aluminum cans adds the same amount of aluminum to the U.S. economy as dismantling over 7,500 airplanes – equivalent to the entire U.S. commercial aircraft fleet.97 Clearly, aluminum cans are a material worth recovering for continued circulation.

Doubling the current annual collection rate of aluminum cans adds the same amount of aluminum to the U.S. economy as dismantling 7,500 airplanes – equivalent to the entire U.S. commercial aircraft fleet.
96 Calculated using the EPA’s Greenhouse Gas Equivalencies Calculator. For reference, one metric ton is about two times as heavy as a grand piano. 97 In our model, once UBC collection rates increase from 48.2% to 96.9%, the annual amount of aluminum recovered from the system increases by 1,189 million pounds, or 539,491 metric tons. Since the mass of a single A330 airplane is 120 metric tons and is made of 60.2% aluminum, the estimated amount of aluminum in a single airplane is calculated at 72.24 metric tons. Therefore, the additional collected aluminum amounts to the aluminum contained in 7,468 airplanes. The U.S. commercial aircraft fleet was 7,356 airplanes in 2018. Sources: Airbus A330 Aircraft Characteristics Airport and Maintenance Planning Technical Sheet. (2005).; Lopes, J. (2010).
Spotlight: Long-term aluminum displacement potential
Once 100% of aluminum cans are collected for recycling, the same aluminum continues to circulate over and over again with less than 6% losses from the recycling process. Each time a can is recycled, it has the potential to reduce demand for primary aluminum. That means the same piece of aluminum can continue to be cycled through the system, with the only losses coming from shredding and remelting processes – resulting in a recycling efficiency rate of just over 94%.98 Aluminum recyclers and manufacturers should explore new technologies to further improve this aluminum recycling efficiency rate to maximize the long-term material displacement potential of aluminum cans.
When adding up these material savings over time, once collection rates reach 100%, one aluminum can recycled over and over again has the potential to displace up to 15 cans’ worth of material over 40 recycling loops (Figure 20). To put this in perspective, we calculate that producing 15 cans from primary aluminum would create 2.64 kg of CO2e, the same amount of emissions from burning 0.3 gallons of gasoline or charging over 300 smartphones.99
If all the 45 billion aluminum cans currently being landfilled each year in the United States were to be collected and recycled 40 times, and if all that material were to displace primary aluminum production, the greenhouse gas emission savings would be the equivalent of taking more than 25 million cars off the road each year.100 That’s about the same as charging 15 trillion smartphones.
Since around 90 billion aluminum cans are used in the United States each year, keeping each aluminum can circulating within the system has massive long-term impact reduction potential. By minimizing the need for primary resource extraction through high value material recovery – and eventually reducing the need for primary aluminum through improved alloy separation technologies – the aluminum can will continue to be a valuable material in the circular economy with minimal reliance on raw materials. For each aluminum can that continues to be processed through this existing circular system, the initial environmental impact of producing primary aluminum is extended across multiple use cycles. These benefits are both seen through closed-loop recycling back into aluminum cans or open-loop recycling in other aluminum production systems.

98 Shredding and melting efficiencies (98.72% and 95.60%) from PE Americas, (2010). 99 Equivalencies calculated using EPA GHG Equivalencies Calculator. 100 45 billion aluminum cans * 2.64 kg CO2-eq from primary aluminum production = 118.8 billion kg CO2-eq. Equivalency results for passenger vehicles driven for one year calculated using EPA GHG Equivalencies Calculator. Note that this calculation only refers to the impact of producing primary aluminum, to highlight the importance of keeping aluminum in circulation as long as possible.
Conclusion and Recommendations
Aluminum Cans
Based on our analysis, aluminum cans are best situated to achieve circularity and maximize impact reduction potential within the existing U.S. recycling infrastructure. Of the three packaging types, aluminum cans have the highest potential to create strong and reliable sources of secondary materials that can compete with primary resources on the open market. The priority for the aluminum can industry will be to ensure products are designed in a way that allows for even more high-value recovery and that require minimal primary material inputs to produce. Since primary aluminum has such high production impacts, the aluminum industry as a whole should actively seek new ways to recover aluminum that has already been discarded, such as through urban or landfill mining,101 rather than relying on primary aluminum production to meet demand.
Glass Bottles
Given the strong material properties of glass bottles and the challenges it faces in the U.S. recycling system, the glass industry should prioritize reuse rather than recycling to maximize impact reduction potential. This is particularly important since melting glass represents the largest life cycle impacts for glass bottles, and the best way to avoid this impact is to keep manufactured glass in circulation. This will require setting up robust and localized collection, cleaning, and distribution networks and new business models to ensure bottles are safely and reliably returned for reuse.
PET Bottles
There are several key challenges with achieving a circular system for PET bottles:
- The material properties of PET degrade when recycled, which limits the number of times the material can be recycled at high value (up to 10 times).102
- Around one-third of the PET material is lost in the mechanical recycling process.
- There are significant barriers to integrating recycled PET into food-grade bottles.
- Virgin PET prices fluctuate with the price of oil.
Because of these combined factors we find it unlikely that recycling PET will systematically displace the production of virgin PET in the current U.S. recycling system. Without displacement, recycling PET bottles only delays the inevitable generation of waste – unless there is a feedback loop to signal reduced PET production when recycling rates increase, the same amount of PET will still end up in landfills, incinerators, and oceans over time.
PET and other plastics have shown to have serious negative impacts on marine life, breaking down into microplastics and being consumed by all levels of the food chain. These microplastics never fully break down or biodegrade, causing cascading negative effects on our oceans and ecosystems. Some companies are exploring refillable PET systems with thicker bottles as a potential strategy to reduce their material and waste footprint, but reusing plastics can be problematic due to sterilization issues and buildup of contaminants, and these bottles still face the same systemic recycling issues at the end of their useful life. Therefore, we recommend a phased approach for shifting the PET market towards a system that is more likely to displace primary PET production.
First, we recommend expanding bottle bill deposit collection systems across the United States to increase material collection and to maximize the amount of PET material that can be reused in food-grade applications at high recycled content limits. Policymakers should ensure deposit systems are designed efficiently and effectively to maximize high-quality material recovery. 103
Second, while bottle bill policies and redemption systems are being set up, the plastics industry should continue to investigate and invest in the potential for chemical recycling technologies, while at the same time critically evaluating the full life cycle impacts and feasibility of scaling up these new processes on a national level. Unless PET bottle producers fundamentally move beyond current recycling strategies and recycled content goals, and instead shift towards a system that allows for continuous high-value material recovery that can compete with primary PET production, the PET bottle production system will never reach a truly circular state.
101 Wagner, T., & Raymond, T. (2015). 102 Spary, S. (September 27, 2019). 103 See the op-ed written by Can Manufacturers Institute and The Aluminum Association for their perspective on what makes an efficient and effective bottle deposit system. Budway, R., & Wilk, L. (March 3, 2020).
A Call to Action
By unpacking the U.S. recycling system, we hope the framework highlighted in this paper can be used by decision-makers in contexts around the world to move beyond simply improving recycling rates and instead focus on whether their products and recycling systems are designed and optimized in a way that can compete with the production of primary materials.
As we have shown through our analysis, a circular beverage packaging system is within reach in the United States if a few key actions are taken across the value chain:
- Business models and collection incentives need to be aligned for each material type (e.g., glass should be driven toward refillable systems; aluminum cans toward increased recycling; and PET towards deposit collection systems).
- Collection rates must be dramatically increased through expanding access to curbside collection while advocating for the bottle bill system to be rolled out across the United States.
- While bottle bill deposit systems are being set up, PET producers should invest in chemical recycling technologies and critically assess the life cycle impacts of these processes, shifting towards renewable sources of energy if impacts are high.
- The aluminum industry should explore new recycling technologies that separate the can top from the can body in the recycling process, which would maintain aluminum alloy properties over multiple recycling loops while raising the recycled content ceiling for aluminum cans.
- MRFs should invest in additional eddy current technologies to ensure all aluminum cans that enter the recycling system can be sorted correctly for recycling.
- Decision-makers – including policymakers and industry groups – should monitor progress toward circularity not just by looking at recycling rates, but also evaluating annual rates of material displacement, measuring whether materials collected for recycling are used in open-loop or closed-loop systems, determining whether materials are recycled into products that can easily be recycled again, monitoring the material and energy efficiency of the recycling process, and quantifying the impact of interventions from a systems-oriented life cycle perspective.
Overall, we need to circulate our materials in ways that maximize their impact reduction potential and allow for reintegration back into the system at the end of their useful life, competing with primary resources.
We have that circular system in place for aluminum cans in the United States, and the existing system can easily process more collected aluminum cans to compete with primary resource production. We started our analysis stating that 45 billion aluminum cans – half of all that are consumed – end up in landfills each year in the United States alone, representing $800 million of wasted value. On the flipside, that means the current U.S. recycling system processes 45 billion cans each year, equal to five million cans being processed every hour. The existing circular system should aim to capture the remaining 50% of lost aluminum cans, keeping these materials in circulation at their highest and best use while maximizing environmental and economic savings.
By implementing tailored recommendations for each packaging type that maximize impact reduction potential, we have the potential of achieving a fully circular beverage container system. This coordinated effort will require action from politicians, manufacturers, and consumers. We must all collaborate to achieve a circular future.
AppendixReferences
AGC Glass Europe. (2020). Our Environmental Impact. Accessed on June 23, 2020. Retrieved from https://www.agc-glass.eu/en/sustainability/environmental-achievements/environmental-impact
Allegrini, E., Vadenbo, C., Boldrin, A., & Astrup, T.F. (2015). Life cycle assessment of resource recovery from municipal solid waste incineration bottom ash. Journal of Environmental Management, 151, 132-143. DOI: 10.1016/j.jenvman.2014.11.032
Amienyo, D., Gujba, H., Stichnothe, H., & Azapagic, A. (2013). Life cycle environmental impacts of carbonated drinks. International Journal of Life Cycle Assessment. 18; 77-92. DOI: 10.1007/s11367-012-0459-y
Anton, K. (January 22, 2019). Happy 60th birthday to the recyclable aluminum can. Molson Coors Blog. Retrieved from https://www.molsoncoorsblog.com/features/happy-60th-birthday-recyclable-aluminum-can
Baekken, I., Bao, S., & Kvithyld, A. (2019). Collection of aluminium packaging today: A literature study on collection systems for aluminium packaging particularly in China, the United States and the European Union. SINTEF Industry, Casting, Forming and Recycling.
Barbutti Gatti, J., de Castilho Queiroz, G., & Correa Garcia, E. (2006). Recycling of Aluminum Can in Terms of Life Cycle Inventory (LCI). International Journal of Life Cycle Assessment, 13;219-225. DOI: 10.1065/lca2006.12.370
Benavides, P., Dunn, J., Han, J., Biddy, M., & Markham, J. (2018). Exploring Comparative Energy and Environmental Benefits of Virgin, Recycled, and Bio-Derived PET Bottles. ACS Sustainable Chemistry & Engineering 6, 8, 9725-9733
Betram, M., Ramkumar, S., Rechberger, H., Romach, G., Bayliss, C., Martchek, K.J., Muller, D.B., & Liu, G. (2017). A regionally-linked, dynamic material flow modelling tool for rolled, extruded and cast aluminum products. Resources, Conservation & Recycling 125, 48-69. http://dx.doi.org/10.1016/j.resconrec.2017.05.014
Bloxsome, N. (September 4, 2020). Bauxite recognised as ‘critical raw material.’ Retrieved from https://aluminiumtoday.com/news/bauxite-recognised-as-critical-raw-material
Brouwer, M.T., Alvarado Chacon, F., & Thoden van Velzen, E.U. (2020). Effect of recycled content and rPET quality on the properties of PET bottles, part III: Modelling of repetitive recycling. Packag Technol Sci.; 33: 373– 383. https://doi.org/10.1002/pts.2489
Budway, R., & Wilk, L. (March 3, 2020). “In our opinion: The right design for container deposits.” Resource Recycling. Retrieved from https://resource-recycling.com/recycling/2020/03/03/in-our-opinion-the-right-design-for-container-deposits/
Buffington, J. (2012). The Beverage Can in the United States: Achieving a 100% Recycled Aluminum Can through Supply Chain Innovation. JOM, 64(8), 923–932. doi:10.1007/s11837-012-0381-6
Buffington, J., & Peterson, R. (2013). Defining a Closed-Loop U.S. Aluminum Can Supply Chain Through Technical Design and Supply Chain Innovation. Journal of Minerals, Metals & Materials Society, 65; 941- 950. DOI: 10.1007/s11837-013-0615-2
Buwalda, T. (2019). Used Beverage Can Recycling Study. Report prepared by Circular Matters LLC for The Aluminum Association and the Can Manufacturers Institute.
Buxmann, K., Kochler, A., & Thylmann, D. (2016). Water scarcity footprint of primary aluminium. International Journal of Life Cycle Assessment 21:1605-1615. DOI: 10.1007/s11367-015-0997-1
Can Manufacturers Institute. (Oct 24, 2017). Cans Are the Most Recycled Drinks Package in the World. Retrieved from https://www.prnewswire.com/news-releases/cans-are-the-most-recycled-drinks-package-in-the-world-300542344.html
Cattaneo, J. (March 12, 2019). 2019 Packaging Outlook: Glass Packaging. Packaging Strategies. Retrieved from https://www.packagingstrategies.com/articles/91045-packaging-outlook-glass-packaging
Changing Markets Foundation. (2020). Talking Trash: The corporate playbook of false solutions to the plastic crisis. Retrieved from https://talking-trash.com/
Closed Loop Foundation. (2017). Investing in glass clean-up systems at MRFs offers higher value commodities and significant savings for the entire system. Retrieved from https://www.closedlooppartners.com/foundation-articles/glass-recycling-research/
Closed Loop Partners. (2017). Cleaning the rPET Stream. Opportunities to strengthen the capital landscape for circular supply chains.
Closed Loop Partners. (2019). Cleaning the rPET Stream: How we scale post-consumer recycled PET in the U.S.
Closed Loop Partners. (2019). Advancing Circular Systems for Plastics. Retrieved from https://www.closedlooppartners.com/research/advancing-circular-systems-for-plastics/
Closed Loop Partners. (2020). Accelerating Circular Supply Chains for Plastics: A Landscape of Transformational Technologies that Stop Plastic Waste, Keep Materials in Play and Grow Markets. Retrieved from https://www.closedlooppartners.com/wp-content/uploads/2020/01/CLP_Circular_Supply_Chains_for_Plastics.pdf
Collier, D., & Stewart, L., (2019). Domestic Processing of rPET Surges Amid Flat Recycling Rate. Loss of Exports Absorbed by Domestic Markets. NAPCOR.
Cruz, S.A., & Zanin, M. (2005). PET Recycling: Evaluation of the Solid State Polymerization Process, Journal of Applied Polymer Science, Vol.99, 2117-2123
Damgacioglu, H., Perez, L., & Celik, N. (2018). Assessment and Evaluation of Contamination in Single Stream Recycling Systems Due to Broken Glass and Other Non-Recyclables. Submitted to the Hinkley Center for Solid and Hazardous Waste Management. Report # 11667
D’Ascenzo, F., Esposito, A. Musarra, M., & Vinci, G. (2019). Glass Beverages Packaging: Innovation by Sustainable Production in Trends in Beverage Packaging, volume 16 from the Science of Beverage Series. ISBN: 978-0-12-816683-3
Detzel, A., & Monckert, J. (2009). Environmental evaluation of aluminium cans for beverages in the German context. International Journal of Life Cycle Assessment. 14; S70-S79. DOI: 10.1007/s.11367-008-0057-1
Dhir, R., De Brito, J., Ghataora, G., & Lye, C. (2018). Production and Properties of Glass Cullet. Sustainable Construction Materials. 35-96. DOI: 10.1016/B978-0-08-100984-00.00003-5
Dyer, T. (2014). Chapter 14: Glass Recycling. Handbook of Recycling. http://dx.doi.org/10.1016/B978-0-12-396459-5.00014-3
EPA. (2019). Advancing Sustainable Materials Management 2017 Fact Sheet. Assessing Trends in Material Generation, Recycling, Composting, Combustion with Energy Recovery and Landfilling in the United States.
EPA. (2019). National Framework for Advancing the U.S. Recycling System. America Recycles. 530-F-19-00
FDA. (2018). Recycled Plastics in Food Packaging. Retrieved from https://www.fda.gov/food/packaging-food-contact-substances-fcs/recycled-plastics-food-packaging
Fernandes, F.C., Kirwan, K., Wilson, P., & Froemder, C. (2018). Environmentally-friendly alternatives for epoxy resin composites based on waste valorisation. Conference paper: SAMPE Europe 2018. Retrieved from https://www.researchgate.net/publication/327645825_Environmentally-friendly_alternatives_for_epoxy_resin_composites_based_on_waste_valorisation
Franklin Associates. (2009). Life Cycle Inventory of Three Single-Serving Soft Drink Containers. Report prepared for the PET Resin Association.
Franklin Associates. (2018a). Life Cycle Impacts for Postconsumer Recycled Resins: PET, HDPE, and PP. Report submitted to The Association of Plastic Recyclers, APR-KC182711. 4037.00.001
Franklin Associates. (2018b). Life cycle impacts of plastic packaging compared to substitutes in the United States and Canada: Theoretical Substitution Analysis. Report prepared for The Plastics Division of the American Chemistry Council (ACC).
Geueke, B., Groh, K., & Muncke, J. (2018). Food packaging in the circular economy: Overview of chemical safety aspects for commonly used materials. Journal of Cleaner Production. 193; 491-505. DOI: 10.1016/j.jclepro.2018.05.005
Gitlitz, J. (2002). Trashed Cans: The Global Environmental Impacts of Aluminum Can Wasting in America. Container Recycling Institute.
Gitlitz, J. (2003). The Role of the Consumer in Reducing Primary Aluminum Demand, Container Recycling Institute prepared for the International Strategic Roundtable on the Aluminum Industry.
Gitlitz, J. (2013). Bottled Up: Beverage Container Recycling Stagnates (2000-2010). The Container Recycling Institute.
Gökelma, M., Meling, I., Soylu, E., Kvithyld, A., & Tranell, G. (2019). A Method for Assessment of Recyclability of Aluminum from Incinerated Household Waste. Data Mining, 1359–1365. DOI:10.1007/978-3-030-05864-7-168
Gomes, T., Visconte, L., & Pacheco, E. (2019). Life Cycle Assessment of Polyethylene Terephthalate Packaging: An Overview. Journal of Polymers and the Environment. DOI: 10.1007/s10924-019-01375-5
Haas W., Krausmann, F., Wiederhofer, D. & Heinz, M. (2015). How Circular is the Global Economy? An Assessment of Material Flows, Waste Production, and Recycling in the European Union and the World in 2005. Journal of Industrial Ecology. DOI: https://doi.org/10.1111/jiec.12244
Hu, Y., Bakker, M.C.M., & de Heij, P.G. (2011). Recovery and distribution of incinerated aluminum packaging waste. Waste Management. 31; 2422-2430. DOI: 10.1016/j.wasman.2011.07.021
International Aluminium Institute (IAI). (2018). Sustainable Bauxite Mining Guidelines. Retrived from http://www.world-aluminium.org/media/filer_public/2018/05/18/170518_sbmg_final.pdf
Jacoby, M. (February 11, 2019). “Why glass recycling in the U.S. is broken.” Chemical and Engineering News. Retrieved from https://cen.acs.org/materials/inorganic-chemistry/glass-recycling-US-broken/97/i6
Kang, D., Auras, R., & Singh, J. (2017). Life cycle assessment of non-alcoholic single-serve polyethylene terephthalate beverage bottles in the state of California. Resources, Conservation and Recycling 116-2017 p. 45-52.
Kersten-Johnston, S., de Thomas, D., Dearman, S., Harrison, K., Huded, K., Meyers, J., Mouw, S., & Schwarze, C. (2019). The Bridge to Circularity. Putting The New Plastics Economy into Practice in the U.S. The Recycling Partnership.
Keep America Beautiful. (2009). National Visible Litter Survey and Litter Cost Study. Final Report. Prepared by MSW Consultants. Retrieved from https://kab.org/wp-content/uploads/2019/08/News-Info_Research_2009_NationalVisibleLitterSurveyandCostStudy_Final.pdf
Kuczenski, B., & Geyer, R. (2013). PET bottle reverse logistics-environmental performance of California’s CRV program. International Journal of Life Cycle Assessment. DOI: 10.1007/s11367-012-0495-7
Kuzuya, M. (2019). A Sorting System for Aluminum Alloy Scrap Based on Laser-Induced Breakdown Spectroscopy. Science Journal of Analytical Chemistry. 7. 65. 10.11648/j.sjac.20190703.11
Lacy, P., Long, J., & Spindler, W. (2020). The Circular Economy Handbook. doi:10.1057/978-1-349-95968-6
Lavee, D. (2010). A cost-benefit analysis of a deposit-refund program for beverage containers in Israel. Waste Management. 30; 338-345. DOI: 10.1016/j.wasman.2009.09.026
Lee, G. (November 15, 2019). The aluminum can: America’s most successful recycling story that you’ve never heard. GreenBiz. Retrieved from https://www.greenbiz.com/article/aluminum-can-americas-most-successful-recycling-story-youve-never-heard
Leroy, C. (2009). Provision of LCI data in the European aluminium industry: Methods and examples. International Journal of Life Cycle Assessment. 14; S10-S44. DOI: 10.1007/s11367-009-0068-6
Letcher, T., & Vallero, D. (2011). Waste: A Handbook for Management. Elsevier, London, p. 153.
Lopes, J. (2010). Life Cycle Assessment of the Airbus A330-200 Aircraft.
Lovik, A.N., & Muller, D.B. (2014). A Material Flow Model for Impurity Accumulation in Beverage Can Recycling Systems. The Minerals, Metals & Materials Society.
Majdinasab, A., & Yuan, Q. (2019). Post-consumer cullet and potential engineering applications in North America. Resources, Conservation and Recycling. 147-2019-1-9. DOI: 10.1016/j.reconrec.2019.04.009
Marathe, K.V., Chavan, K.R., & Nakhate, P. (2019) Life Cycle Assessment (LCA) of PET Bottles. Recycling of Polyethylene Terephthalate Bottles; Plastic Design Library (p. 149-168).
McMillan, C.A., & Keoleian, G.A. (2009). Not all primary aluminum is created equal: Life cycle greenhouse gas emissions from 1990 to 2005. Environ. Sci. Technol. 43, 5, 1571-1577. https://pubs.acs.org/doi/abs/10.1021/es800815w
Meherishi, L., Narayana, S.A., & Ranjani, K.S. (2019). Sustainable packaging for supply chain management in the circular economy: A review. Journal of Cleaner Production. 237; 117582. DOI: 10.1016/j.jclepro.2019.07.057
Mouw, S., Schwartz, L., & Yarkosky, S. (2020). State of Curbside Recycling Report. The Recycling Partnership.
National Association of PET Container Resources (NAPCOR) & The Association of Plastic Recyclers (APR). (2018). Report on Postconsumer PET Container Recycling Activity in 2017.
National Geographic. (April 4, 2018). 7 Things You Didn’t Know About Plastic (and Recycling). Retrieved from https://blog.nationalgeographic.org/2018/04/04/7-things-you-didnt-know-about-plastic-and-recycling/
Nessi, S., Bulgheroni C., Garbarino, E., Garcia-Gutierrez, P., Orveillon G., Sinkko, T., Tonini, D., & Pant, R. (2018). Environmental sustainability assessment comparing through the means of life cycle assessment the potential environmental impacts of the use of alternative feedstock (biomass, recycled plastics, CO2) for plastic articles in comparison to using current feedstock (oil and gas). JRC Technical Reports, European Commission.
Niero, M., & Olsen Irving, S. (2016). Circular economy: To be or not to be in a closed product loop? A Life Cycle Assessment of aluminium cans with inclusion of alloying elements. Resources, Conservation and Recycling 114; 18-31. DOI: 10.1016/j.resconrec.2016.06.023
Niero, M., Hauschild, M.Z., Hoffmeyer, S.B., & Olsen Irving, S. (2017). Combining Eco-Efficiency and Eco-Effectiveness for Continuous Loop Beverage Packaging Systems: Lessons from the Carlsberg Circular Community. Journal of Industrial Ecology. DOI: 10.1111/jiec.12554
Nordelöf, A., Poulikidou, S., Chordia, M., de Oliveira, F.B., Tivander, J., & Arvidsson, R. (2019). Methodological Approaches to End-Of-Life Modelling in Life Cycle Assessments of Lithium-Ion Batteries. Batteries, 5, 51. doi:10.3390/batteries5030051
Novelis. (May 2, 2013). Novelis Introduces High-Recycled Content Aluminum for Beverage Cans, Launches World’s First Recycled Content Certification Program. Retrieved from http://investors.novelis.com/2013-05-02-novelis-introduces-high-recycled-content-aluminum-for-beverage-cans-launches-worlds-first-recycled-content-certification-program
Nunez, P., & Jones, S. (2016). Cradle to Gate: Life Cycle Impact of Primary Aluminium Production. International Journal of Life Cycle Assessment 21: 1594-1604. DOI: 10.1007/s11367-015-1003-7
Nuccitelli, D. (July 30, 2018). “America spends over $20bn per year on fossil fuel subsidies. Abolish them.” Retrieved from https://www.theguardian.com/environment/climate-consensus-97-per-cent/2018/jul/30/america-spends-over-20bn-per-year-on-fossil-fuel-subsidies-abolish-them
Oceana. (2020). Just One Word: Refillables. How the soft drink industry can – right now – reduce marine plastic pollution by billions of bottles each year. Final Report. Retrieved from https://oceana.org/publications/reports/just-one-word-refillables
Oregon Department of Environmental Quality. (2011). Composition of Commingled Recyclables Before and After Processing. Report prepared for the Oregon Commingled Recycling System Improvement Workgroup.
Palazzo, J., Geyer, R., Startz, R., & Steigerwald, D. (2019). Causal inference for quantifying displaced primary production from recycling. Journal of Cleaner Production. 210, p. 1076-1084. https://doi.org/10.1016/j.clepro.2018.11.006
Papadogeorgos, I., & Schure, K.M. (2019). Decarbonisation Options for the Dutch Container and Tableware Glass Industry. PBL Netherlands Environmental Assessment Agency.
Parts, C. (2019). Waste Not Want Not: Chinese Recyclable Waste Restrictions, Their Global Impact, and Potential U.S. Responses. Chicago Journal of International Law: Vol. 20: No. 1, Article 8. Available at: https://chicagounbound.uchicago.edu/cjil/vol20/iss1/8
PE Americas. (2010a). Environmental Overview: Complete Life Cycle Assessment of North American Container Glass. Report conducted to the Glass Packaging Institute (GPI).
PE Americas. (2010b). Life Cycle Impact Assessment of Aluminum Beverage Cans. Prepared for the Aluminum Association Inc.
PE International. (2014). Update to the Aluminum Can LCA Study: A Technical Memorandum prepared by PE International for the Aluminum Association.
Reclay StewardEdge Inc. (2014) Research and Analysis of Policies that Drive Increased Recycling. Report prepared for the Carton Council of North America.
Roudsari, G.M., Mohanty, A.K., & Misra, M. (2017). Green Approaches to Engineer Tough Biobased Epoxies: A Review. ACS Sustainable Chem. Eng. 5. 11. 9528-9541. https://pubs.acs.org/doi/abs/10.1021/acssuschemeng.7b01422
RTI International. (2003). Life-Cycle Inventory Data Sets for Material Production of Aluminum, Glass, Paper, Plastic and Steel in North America. Report prepared for the U.S. Environmental Protection Agency – Office of Research and Development.
Scalet, B.M, Garcia Muñoz, M., Sissa, A.Q., Roudier, S., & Delgado Sancho, L. (2013). Best Available Techniques (BAT) Reference Document for the Manufacture of Glass. Joint Research Centre, European Commission. Industrial Emissions Directive 2010/75/EU. https://publications.jrc.ec.europa.eu/repository/bitstream/JRC78091/lfna25786enn.pdf
Shen, L., et al. (2011). Life cycle energy and GHG emissions of PET recycling: change-oriented effects. International Journal of Life Cycle Assessment, 16:522–536. DOI 10.1007/s11367-011-0296-4
Simmons, S. (2020). Aluminum Beverage Can: Driver of the U.S. Recycling System. GBB Solid Waste Management Consultants, report prepared for the Can Manufacturers Institute (CMI).
Simon, B., Ben Amor, M., & Foldenyi, R. (2015). Life cycle impact assessment of beverage packaging systems: focus on the collection of post-consumer bottles. Journal of Cleaner Production. DOI: 10.1016/j.jclepro.2015.06.008
Spary, S. (September 27, 2019). National Recycling Week 2019: How Many Times Can One Plastic Bottle Be Recycled? Huffington Post UK. Retrieved from https://www.huffingtonpost.co.uk/entry/how-many-times-can-one-plastic-bottle-be-recycled_uk_5bc9b98be4b0d38b58771df3
Speck, R.L. (2014). A comparative analysis of commercially available life cycle assessment software. Dissertation submitted to Michigan State University in partial fulfillment of the requirements for the degree of Packaging – Doctor of Philosophy.
Speck, R. L., Selke, S., Auras, R., & Fitzsimmons, J. (2015). Choice of Life Cycle Assessment Software Can Impact Packaging System Decisions. Packaging Technology and Science. 28; 579-588. DOI: 10.1002/pts.2123
Speck, R. L., Selke, S., Auras, R. & Fitzsimmons, J. (2015). Life Cycle Assessment Software: Selection Can Impact Results. Journal of Industrial Ecology. DOI: 10.1111/jiec.12245
Stotz, P.M., Niero, M., Bey, N., & Paraskevas, D. (2017). Environmental screening of novel technologies to increase material circularity: A case study on aluminium cans. Resources, Conservation & Recycling, 127; 96-106. DOI: 10.1016/j.resconrec.2017.07.013
Sullivan, L. (September 11, 2020). How Big Oil Misled The Public Into Believing Plastic Would Be Recycled. NPR. Retrieved from https://www.npr.org/2020/09/11/897692090/how-big-oil-misled-the-public-into-believing-plastic-would-be-recycled?t=1600867311394
Systemiq. (2020). Breaking the Plastic Wave: A Comprehensive Assessment of Pathways Towards Stopping Ocean Plastic Pollution. Retrieved from https://www.systemiq.earth/wp-content/uploads/2020/07/BreakingThePlasticWave_MainReport.pdf
Testa, M., Malandrino, O., Sessa, M., Supino, S., & Sica, D. (2017). Long-Term Sustainability from the Perspective of Cullet Recycling in the Container Glass Industry: Evidence from Italy. Sustainability, 9, 1752; DOI: 10.3390/su9101752
The Aluminum Association. (2019). The Aluminum Can Advantage: Key Sustainability Performance Indicators. Retrieved from https://www.aluminum.org/sites/default/files/KPI%20Report%202019.pdf
The American Chemistry Council (ACC) & The Association of Plastic Recyclers (APR). (2019). 2018 United States National Postconsumer Plastic Bottle Recycling Report.
The Container Recycling Institute (CRI). (2008). Wasting and Recycling Trends: Conclusions from CRI’s 2008 Beverage Market Data Analysis.
The Container Recycling Institute (CRI). (2015). Estimating Beverage Container Litter Quantities and Cleanup Costs in Michigan. Final Report.
The Container Recycling Institute (CRI). (2020). Data derived from “2017 Beverage Market Data Analysis.”
The Glass Recycling Coalition. (2018). 2018 Glass Recycling Survey: Results.
Tsai, C.L., & Krogmann, U. (2012). Material Flows and Energy Analysis of Glass Containers Discarded in New Jersey, USA. Journal of Industrial Ecology. DOI: 10.1111/j.1530-9290.2012.00509.x
UNEP, Ellen MacArthur Foundation & New Plastics Economy (2019). The New Plastics Economy: Global Commitment 2019 Progress Report. Retrieved from https://www.newplasticseconomy.org/assets/doc/Global-Commitment-2019-Progress-Report-Summary.pdf
U.S. Environmental Protection Agency (EPA) & ICF International. (2016). Documentation for Greenhouse Gas Emission and Energy Factors Used in the Waste Reduction Model (WARM). Containers, Packaging, and Non-Durable Good Material Chapters. https://www.epa.gov/sites/production/files/2016-03/documents/warm_v14_containers_packaging_non-durable_goods_materials.pdf
Van der Haarst, E., Potting, J., & Kroeze, C. (2015). Comparison of different methods to include recycling in LCAs of aluminium cans and disposable polystyrene cups. Waste Management. DOI: 10.106/j.wasman.2015.09.027
Wagner, T., & Raymond, T. (2015). Landfill mining: Case study of a successful metals recovery project. Waste Management, Vol. 45, p. 448-457. https://www.sciencedirect.com/science/article/pii/S0956053X15300052
Wenzel, E. (May 22, 2020). “Will Recycled Plastics Survive Tanking Oil Prices?” Retrieved from https://www.greenbiz.com/article/will-recycled-plastics-survive-tanking-oil-prices
Zink, T., Geyer, R., & Startz, R. (2017). Toward Estimating Displaced Primary Production from Recycling: A Case Study of U.S. Aluminum. Journal of Industrial Ecology. DOI: 10.1111/jiec.12557
Zink, T., & Geyer, R. (2018). Material Recycling and the Myth of Landfill Diversion. Journal of Industrial Ecology. DOI: 10.1111/jiec.12808