Table of Contents
Foreword Alpro
Plant-based foods are highly resource efficient and part of the solution towards a more healthy and sustainable diet. Over the past years, at Alpro we’ve been asking ourselves the question: is what we’re doing good enough? We are all increasingly familiar with the need to understand the impact of products or services to determine to what extent should we further reduce their ecological footprint. We recognize that we must do better to operate within the limits of our planet’s natural capacity.
Food companies have a crucial responsibility in understanding and reducing their contribution to these impacts. Setting science-based targets is a way for them and other companies to look at ecological performance in the context of what is needed for a healthy and resilient planet for future generations. Alpro could not have done this work without WWF, and we firmly believe the successful company of the future develops and works towards shared goals with NGOs.
As a pioneer in sustainability, at Alpro we are proud to have pilot-tested this approach to translating planetary boundaries to scales necessary to bring production within a safe operating space. After all, there is only one good outcome. And that is being able to offer consumers products that are produced within the carrying capacity of our one and only planet.
Greet Vanderheyden Senior Sustainable Development Manager, Alpro
Foreword WWF Netherlands
The nature conservation agenda is not only about securing the future of tigers, pandas, whales and all the amazing diversity of life we love and cherish on Earth. It’s bigger than that. Our day-to-day life, health and livelihoods depend on a healthy planet. There cannot be a healthy, happy and prosperous future for people on a planet with a destabilized climate, depleted oceans, degraded land and empty forests, all stripped of biodiversity, the web of life that sustains us all.
Science has never been clearer about the consequences of our impact. This is not a doom and gloom story; it is reality. The astonishing decline in wildlife populations shown in the latest published Living Planet Index – an average decline of 60 per cent over 40 years – is a grim reminder, and perhaps the ultimate indicator, of the pressure we exert on the planet. Today, we have the knowledge and means to redefine our relationship with the planet. But having the facts does not automatically result in taking action. We are convinced that ensuring a healthy and resilient planet for generations to come requires that human development is decoupled from environmental degradation. Unfortunately, even though we see many positive developments towards sustainable consumption and production, a crucial economic transition still awaits. One reason for this is that so far, the cumulative effect of incremental changes made by many different actors does not bring the systemic changes needed to operate within planetary boundaries.
To take the step from doing better to what is needed, some years ago, WWF Netherlands started the One Planet Thinking program, alongside our ongoing work on Science Based Targets for Nature.
In collaboration with Metabolic, we analyzed and mapped existing sustainability approaches. The result was a landmark report outlining what is needed for moving from an ambitious concept to an approach that could be piloted and operationalized by business.
In this pilot, Alpro are pioneers in testing emergent thinking for setting science-based land, water, nutrient, and biodiversity targets that respect planetary boundaries, to complement their existing commitment to carbon targets.
We believe that this report marks crucial progress towards going beyond business-as-usual in developing measures of success, and is a milestone in the transformation of how we manage natural resources.
Marieke Harteveld Chief Conservation Officer, WWF Netherlands

Executive summary
Over the last decades, it has become increasingly clear that environmental impacts from human activities are threatening the ongoing functioning of the Earth system. Despite the many sustainability initiatives currently underway internationally (from corporate sustainability efforts to broader transitions towards more sustainable consumption), we are failing to stop some of the more concerning global trends, including climate change and biodiversity loss. To address this problem, there is an urgent need to understand and measure the impacts of our production and supply chains relative to absolute planetary limits.
Planetary boundaries: a compass for target-setting
The Planetary Boundaries (PB) framework, introduced by the Stockholm Resilience Centre (SRC) in 2009, is currently the most broadly studied and utilized approach for relating human impacts to planetary limits (Rockström et al., 2009; Steffen et al., 2015). The framework identifies nine processes that regulate the stability and resilience of the Earth system as a whole. It then proposes quantitative boundaries within which human and natural worlds can continue to thrive. Crossing these boundaries increases the risk of generating large-scale abrupt or irreversible environmental changes. Out of the nine boundaries, SRC has estimated that we have already transgressed four: climate change, biodiversity loss, phosphorus and nitrogen biogeochemical flows, and land system change.
One planet thinking pilot with Alpro
Companies are a core stakeholder in defining the transition pathways towards a sustainable economy. Alpro, a producer of plant-based food and drink products, is one of the pioneers in setting impact reductions in line with limits of our planet. In 2015, they worked with WWF and consultancy Ecofys to define an initial set of science-based targets for their greenhouse gas emissions. Since that time, Alpro has continued to work towards advancing the methodologies and practical tools needed to mainstream this science-based approach to environmental target setting.
The Science Based Targets Initiative was established to bring corporate commitments on emissions to the necessary level for avoiding catastrophic climate change. Developed in partnership with the World Resources Institute, United Nations Global Compact, and CDP, helps companies establish greenhouse gas emissions reduction targets in line with climate science. Though not the first effort of this kind, the SBTi has been rapidly and broadly adopted, signaling that the corporate world is beginning to understand the urgent need for the role of science in environmental target setting. Some of the most significant boundaries that need to be evaluated for companies that are dependent on agricultural raw materials, such as Alpro, are those directly impacted by agricultural production: land-use, freshwater use, nitrogen cycle disruption (e.g., through fertilizer application), and biodiversity loss. In this report, we present the results of a study exploring how these four critical boundaries can be assessed throughout Alpro’s value chain and used to set science-based targets.
Science-based targets: beyond carbon
In order to be able to set and implement science-based targets, we need tools for identifying the critical boundaries in the Earth system, determining how much “impact” the often moving system is capable of absorbing, and then fairly distributing this impact “budget” among participating actors. The key challenges to achieving this as scale include:
- Defining boundaries: In the PB framework, boundaries are defined a certain distance from the presumed tipping point, creating a safety buffer. There is still uncertainty about the kinds of impacts that are likely to contribute to transgressing the boundaries, and the complex interactions that occur between impacts and boundaries through feedback mechanisms. Setting boundaries inevitably becomes open to interpretation, to what we consider socially acceptable losses and risks.
- Downscaling boundaries to appropriate scales: For most of the boundaries identified in the PB framework, there are localized and regional tipping points to take into consideration. A much greater spatial and temporal resolution is required, as well as sufficient knowledge of localized conditions and dynamics.
- Translating activities into impacts: It is challenging to translate the actions of an individual or company directly into its impacts on a given boundary. Therefore, though some of these boundaries may be expressed in the form of states (e.g., total genetic richness), they must be reliable translated into flows (e.g., number of trees cut) that can actually be related to the activities of companies or other actors.
- Allocation: The challenge of allocation involves social, economic, and environmental tradeoffs and is also inherently a moral question. We explore allocation in this study, and propose approaches that are best aligned with available science, however, there are some aspects of this step that must ultimately be addressed with a political and stakeholder process to be considered legitimate and fair.
Advancing the science
The pilot study with Alpro described in this report, was largely geared towards addressing some of these challenges by further developing and field testing sometimes novel methodologies for boundaries other than climate. The freshwater targets have been assessed using WWF’s current potential methodological approach to setting a Context-Based Water Target, executed with support from Good Stuff International (GSI).1 The biodiversity assessment was conducted by researchers from Wageningen University (WUR) and Plansup using the Biodiversity Footprint methodology (BioFP). Baseline impact assessment, exploration of additional methodologies for nitrogen and land-use boundaries, as well as overall project coordination was conducted by Metabolic.
1Broader conversations are ongoing around the possibility of merging the more recent work on Context-Based Water Targets into the Science-Based Target Network. As this is still in progress this work continues to be referred to as Context-Based Water Targets in this paper, hereafter referred to simply as CBWT
The pilot project was divided into three sequential phases:
Phase 1: Selecting cases
In the first phase of the project we conducted a baseline impact assessment on Alpro’s almond and soy drink value chains in Spain and France, respectively. Three almond farms in Spain’s Ebro basin were selected for further study (hereafter referred to as Farms 1, 2, and 3). A group of farms in the French Alsace region were also chosen for analysis. The map below shows the location of the Spanish almond farms.
Phase2: Boundary and target setting
The second phase of the project comprised the bulk of our research: we developed the methodologies for determining the boundary for the four selected impact areas (land-use, freshwater, nutrient cycles, and biodiversity), evaluated the degree to which the boundary had been crossed, allocated the contribution of the individual farm’s impact to crossing the boundary, and set targets for staying within the boundary. These steps were executed separately for each boundary by each of the three teams working on the project. Because the starting methodologies were at different levels of development and the data was not uniformly available across topics, we were able to make more progress on some of the boundary assessments than on others. The table on this page summarizes the different impact areas we evaluated throughout this research.

This research is based on desktop analysis only; no further conclusions can be drawn from it other than those within the scope of the research.
Freshwater balance boundary
The Context Based Water Targets approach proposes the use of two different boundaries to create a more comprehensive method to account for both blue and green consumption of water at the basin-scale:
- Environmental flow (which is affected by blue water consumption). An Environmental Flow (EF) is defined within the Brisbane Declaration (2007) as “the quantity, timing and quality of waterflows required to sustain freshwater and estuarine ecosystems and the human livelihoods and well-being that depend on these ecosystems.” This means that it is not appropriate to set a global value for EF, and as such the EF requirements for any given river needs to be assessed at a local scale.
- Green water consumption boundary: natural vegetation land cover. Water is a renewable resource and one that all living organisms use. While consumptive use by animals is largely inconsequential, the consumptive use by plants is important when determining flows in basins. With this concept in mind, land use by natural vegetation could present a potential indicator that can assess the sustainability of green water consumption within a basin.
The assessment of the boundary conditions in the Rio Canaleta for both natural vegetation and for environmental flows appear to imply that the use of water in this area is theoretically within a sustainable range. The assessment was a desktop exercise and did not include engaging local water users on the their views on the determined boundary conditions. A credibly defined boundary requires some degree of social negotiation, as such this assessment can only infer a limited conclusion that the green-water based (i.e., rainfed) almond growing within the Rio Canaleta could be considered sustainable.
The freshwater balance data was used to conduct desktop testing of two potential approaches to allocation of freshwater, namely: percentage use of remaining land and contribution to GDP. These desktop tests highlighted that both approaches benefited and disadvantaged different economic sectors in different ways. In addition, application of a single allocation lens did not adequately account for broader Nexus trade-offs, since issues like food security go beyond just economic development.
Nitrogen cycle boundary
We assessed the nitrogen cycle on two impact areas to analyze the boundary for biogeochemical flows. When interacting with thenatural world, a surplus of nitrogen causes a series of negative impacts on a range of scales, from local to global. The figure below (adapted from Erisman et al., 2013) outlines these impacts, ranging from highly localized impacts such as nitrogen deposition to global impacts such as climate change. Ideally, a nitrogen boundary framework would include a limit for each of these scales and set local targets for farms in such a way that all boundaries are kept within the “safe operating space”; in other words, taking the most stringent boundary as the guideline for target setting. Our pilot outlines a framework for analyzing boundaries and targets for two of these categories:
- nitrate/nitrite deposition on the land surrounding the farms, and
- freshwater pollution on the basin level.
For the purpose of the pilot with Alpro, we selected Farm 2 for the application of our framework, since, out of the three farms selected for closer evaluation, this is the only one applying synthetic fertilizer (283 kg of fertilizer each year on 3.4 hectares). The results of our calculations show that Farm 2 is crossing both terrestrial nitrogen deposition limits as well as contributing disproportionately to the crossing of aquatic nitrogen limits, as shown in the figure below.

Land-use boundary
In this study, we identified four scales on which land-use boundaries should ideally be evaluated: global / biome level, regional, landscape, and farm. We were able to evaluate the two higher level boundaries (global and regional), and defined an approach for evaluating the smaller-scale boundaries that needs further testing.

- Global-scale boundaries: Sloan et al. (2014) assess land-cover disturbance using the Natural Intact Vegetation index. NIV is the remaining natural vegetation area as a percentage of the originally-vegetated area. The individual patches of undisturbed habitat become dramatically smaller as total NIV decreases, falling precipitously when NIV falls below 10%, which is likely to put certain species types at great risk. The Mediterranean Forest, Woodland, and Scrub (MFWS) biome, where the studied almond farms are located, has already fallen slightly below the critical tipping point of 10% NIV. The Temperate Broadleaf and Mixed Forest (TBMF) biome, where the soy farms investigated in this study are located, has not yet crossed the 10% tipping point, but has exceeded the critical boundary of 20%, with only 18,6% of NIV remaining. Therefore, both of the biomes under investigation in this study have exceeded safe thresholds as proposed by the literature, though the Mediterranean region where the almond farms are located is in a more critical state.
- Regional-scale boundaries: The almond farms evaluated in this study lie in the Mediterranean basin, which is part of the MFWS biome. Large parts of this biome have historically been converted to functions such as agriculture. The NIV index for the global MFWS biome is 9.9%. Zooming in on the Mediterranean basin specifically, we see that NIV is even lower, at 4.4% (Sloan et al. 2014). This means that the Mediterranean basin is disproportionately contributing to the loss of NIV in the MFWS biome and is itself even further beyond the globally identified tipping point than other regions representative of this biome. Natural habitats in this region are, therefore, in urgent need of recovery.

- Landscape-scale boundaries: The Rio Canaleta sub-basin, where our three almond farms are located, has a very high percentage of natural land cover (73.8%) relative to the rest of the Mediterranean basin. The farms themselves are located close to nature areas, including some protected Natura 2000 zones. In terms of the whole region, this sub-basin is likely to be one of the areas where NIV is at its highest. This has implications for the selected farms: it is possible that they should be targeted as areas for rewilding in the future, or at the very least, apply biodiversity-friendly practices under a “land sharing” model.
- Farm-scale boundaries: At the scale of individual farms, the overall percentage of NIV in a particular biome is of lower importance. Rather, boundaries are more related to habitat fragmentation, species, and biodiversity, and what function or ecosystem services the farm itself provides to its surrounding area. Because the local landscape is highly species-, habitat-, and land-use-specific, it must be understood on a case-by-case basis. Recommendations at this scale center around the adoption of biodiversity-enhancing practices suited to this particular region and the surrounding species.
Biodiversity footprint
The Biodiversity Footprint was assessed for 1 liter of almond drink and 1 liter of soy drink without packaging. The almond drink footprint is based on the production chain for almond paste produced by the cooperative in Spain. The soy drink footprint is based on soy production by a cooperative in France.
- Almond drink biodiversity footprint: Land use has the largest contribution to the biodiversity footprint of almond drink (80%). Per unit of area, organic farms have a smaller biodiversity impact (loss of about 70% of the original species) compared to intensive, irrigated farms (loss of about 90% of the original species). However, when looking at the impact per unit of almond drink produced, the much lower yield of organic farms translates to a higher biodiversity footprint overall, because a significantly larger area of land is needed for the same amount of almond production.
- Soy drink biodiversity footprint: Just as in the case of almond, land use causes the most significant contribution to the biodiversity impacts of soy production. There was no data available on different management levels between the selected soy farms, beyond production and application of fertilizer and pesticides per region. Therefore it is difficult to relate differences in footprint to different management practices at farm level. Nevertheless, for soy farms a higher productivity is expected to lead to a lower biodiversity footprint.

The table below shows a high-level overview of the combined Phase 2 findings of all three research teams.

Phase 3: Strategies for impact mitigation
From our contextual research we have shown that for a majority of key impact areas, agricultural activities are the source of the most significant impacts, which is the reason that we have focused on farms in this study. Once high-priority farms have been identified, where it is clear that one or more of the “safe” boundaries has been transgressed, there are three main topic areas that need to be considered before being able to craft a suitable package of mitigation measures:
- Mitigation effectiveness: Can the transgression of the crossed boundaries be mitigated by applying efficiency improvements or best practices? Or are the transgressions severe enough that more radical measures (such as removal of the target activities) need to be applied?
- Trade-offs: Are there trade-offs between mitigation measures for the boundaries that have been crossed? Which boundaries are most severely crossed relative to one another? It is essential that boundaries are not considered in isolation from one another. Rather, these impacts should be looked at simultaneously in order to develop optimized solutions that address all problems synergistically.
- Degree of influence: Which stakeholders need to participate to successfully implement the recommended interventions? Can the identified impacts be brought within the boundaries through the actions of single actors, like the farmers themselves? Or do they require coordination between multiple stakeholders at higher spatial scales?
The different considerations explored through these questions are visualized schematically in the figure below. These questions must be answered within the context of each farm before an adequate mitigation strategy can be developed.

Conclusions and gaps
This research represents an important step forward in tackling the complexities of interpreting global boundaries at a level that is usable for companies and their supply chains. Through this pilot our research consortium had the opportunity to develop and test a broad range of methods for science-based target setting. Such an open and collaborative process naturally facilitated a great deal of progress on these topics, and revealed gaps, shortcomings, and new questions to resolve in the next steps of this research. Some of the emergent conclusions and discussion points include:
- A systemic approach is essential. An important higher-level finding of this study is that the evaluation of impact areas against boundaries should not occur in isolation, but rather, must be looked at coherently as part of a single assessment. A systemic perspective allows for the comprehensive evaluation of trade-offs between competing objectives, the opportunity to discover synergistic interventions, and also ensures consistency in methodologies and measurement techniques.
- Missing: an approach for evaluating trade-offs. There is currently no system for prioritizing between competing impact mitigation objectives. Such a scheme will need to be based in both scientific knowledge and moral values, meaning that it is likely to be contentious because it needs to ultimately rest on personal judgments. Without at least some form of agreed-upon principles – perhaps in the form of a decision-tree – for trading off between different impacts, it will be challenging to come to actionable mitigation strategies for multiple boundaries simultaneously. We recommend that the various NGOs and networks currently engaged in the science-based targets movement support the development of such a prioritization system.
- Not all boundaries were fully evaluated. For some of the boundaries that we set off to set targets for, there are more tipping points that should ultimately be evaluated than we were able to consider in this pilot. For example, not just local nitrogen deposition and aquatic nitrogen concentrations should be considered when looking at a nitrogen boundary, but also more aggregated downstream impacts such as the effect of nitrogen on coastal eutrophication. For the land use boundary, we did not consider potential tipping points resulting from land-use change in the dimension of carbon sinks, water cycles, or biogeochemical flows, which should also all ultimately be considered.
- Spatial and temporal dimensions: need more resolution. By their very nature, the evaluation of the boundaries selected in this study requires both spatial and temporal resolution (at different scales, depending on the particular impact area in question). Though progress was made in this respect, and we believe we have identified the appropriate spatial and temporal scales for some of these boundaries (e.g., freshwater evaluations on a sub-basin level), there is more work to be done in this regard for some of the indicators, for example, the appropriate temporal scale to assess soil degradation in different production systems.
- Further work needed on allocation principles. Though we explored possible approaches to allocation, it is clear that more work is needed in this area to develop a methodology that consistently results in sensible outcomes. In cases where there are multiple actors jointly contributing the transgression of a boundary that they all influence, an allocation mechanism becomes necessary.
- Ground-truthing and peer review needed. The results of this research make it clear that though the methodologies developed here hold promise, they need further development, ground-truthing, and peer review. With the results of this ground-truthing, we will be able to more accurately assess which of these methodologies show the greatest promise, and to evaluate the degree to which contextual, spatial, and temporal data is necessary to provide accurate guidance on a farm level.
- Social impacts of Science-Based Targets. Interventions should seek to, where possible, simultaneously improve conservation, production, and livelihood objectives. Where trade-offs occur, decision-making should be conducted through self-organised, participatory processes which are informed by robust scientific knowledge. The implementation of science-based targets can be seen as a social process informed by science, not determined by it.

Next steps
There are many next steps that emerge from our findings – ranging from necessary technical adjustments to the methodologies, to broader inquiries that should be taken up by the entire science-based targets movement. Some of the higher-level research directions include:
- Building upon the methodologies tested in this report. There is a great deal of work to be done in further refining and expanding the methods tested here – from integrating more temporal resolution to assessing additional tipping points. The models should be ground-truthed and peer-reviewed.
- Scaling and automation. Once the methods are further refined, it is important to work towards possibilities for scaling these approaches through automation. Ideally, a great deal of the necessary data for calculating localized science-based targets can be acquired through remote sensing or available datasets. With some basic tooling in place, additional pilots can be run with a much larger number of farms.
- Development of agriculture-specific allocation approaches. An identified gap in our research is the development of an allocation method specifically tailored to the agricultural sector. This method should ideally consider parameters such as the geographical suitability and nutritional value of different products. Such an approach should ideally be developed in the context of a pilot with local stakeholders to test out the technical implications, feasibility, acceptance, and appropriateness of different allocation approaches and their outcomes.
- Development of a working agreement for prioritizing between trade-offs. We recommend that the various NGOs and networks currently engaged in the science-based targets movement support the development of a system (or decision-tree approach) that can be used for the prioritization of different mitigation approaches. This is essential when considering multiple boundary transgressions of different types.
- Development of a better understanding of the per capita “budgets” for land, freshwater, and other common resources. We currently have a poor understanding of how the planetary boundaries (or regional boundaries) will translate to a per-capita “safe operating space” in different regions. This makes it challenging to understand how much land we should ideally be allocating to different food groups or for the production of other resources, like fiber for clothing.
Next steps for Alpro
In addition to these higher-level research questions, some of which will have direct bearing on Alpro’s continuation of this work with its own supply chain, there are specific activities that we believe Alpro should undertake as a next, value-adding step in continuing this pilot.
- Further develop the land-use methodology. The land-use methodology provides a geospatial assessment framework on which all other methodologies can be further built, providing an integrated management and monitoring lens for the different issue areas at hand (from freshwater to biodiversity).
- Co-creative process. It is clear that further work must bring the farmers and other affected stakeholders into a central dialogue on how to move forward. Alpro, in collaboration with its farming cooperative partners, can initiate and host this stakeholder engagement process as a core part of the next phase of the pilot.
- Farmer support. In the transition towards operating within planetary boundaries, various measures will ultimately need to be applied. A farm-level toolkit (which could be modeled on the Biodiversity Monitor that has been developed by WWF-Netherlands for Dutch dairy farmers) could be a useful resource for identifying the most suitable farm-level interventions.
- New ways of thinking. It may be that the above stakeholder process will result in the need for radically new approaches for sharing the responsibility of sustainable agriculture within a region. For example, new financial incentives may need to be designed to reward farmers who are protecting biodiversity and ecosystem services. The results of these efforts should be continuously monitored for their effectiveness with adjustments made as necessary.
Though there is still a long road to travel as we move towards an agricultural system that operates within the boundaries of our one planet, the progress made through this research is a testament to the power of collaboration between sectors. With rapid cycles of learning, which can only be achieved through openness to potential failure, we hope to quickly move towards scalable and replicable approaches for addressing human needs while allowing nature to thrive.

Introduction
In recent decades, it has become increasingly clear that environmental impacts from human activities are threatening the ongoing functioning of the Earth system. Despite the many sustainability initiatives currently underway internationally (from corporate sustainability efforts to broader transitions towards more sustainable consumption), we are failing to stop some of the more concerning global trends, including climate change and biodiversity loss. To address this problem, there is an urgent need to understand and measure the impacts of our production and supply chains relative to absolute planetary limits.
Towards science-based targets
With this understanding, a shift has begun towards target-setting for environmental impact reduction based on scientific assessments of available impact “budgets.” One of these efforts, the Science-Based Targets Initiative (SBTi), has engaged almost 500 companies in establishing or working towards greenhouse gas emissions reduction targets in line with scientific recommendations to maintain global mean temperature rise below 2°C. To date, 151 companies have set targets in line with SBTi’s approach. However, though climate change is an undeniably grave issue, it is not the only environmental impact we need to address on our pathway towards a sustainable future. The Planetary Boundaries (PB) framework, originally published by Johan Rockström and Will Steffen, defined nine key Earth systems that need to be kept within a “safe” range in order to avoid crossing likely tipping points, of which climate change is only one (Rockström et al., 2009; Steffen et al., 2015). Other boundaries, such as those defined for biodiversity loss and the disruption of global biogeochemical flows, are even more severely transgressed. The One Planet Thinking program (OPT) was initiated by WWF-Netherlands and its partners to explore the ways that companies can assess the full impacts of their operations to ensure they are working within the safe operating space of our one planet, as conceptualized by the PB framework.
Companies blazing the trail
Companies are a core stakeholder in defining the transition pathways towards a sustainable economy. Their active participation is indispensable in the necessary learning and piloting process for setting impact reduction targets in line with the limits of our planet. Alpro, a producer of plant-based food and drink products, is one of the pioneers in this space. The company joined WWF’s Climate Savers program in 2011, and in 2015, worked with WWF and consultancy Ecofys to define an initial set of science-based targets for their greenhouse gas emissions. Alpro has continued subsequently to work towards advancing the methodologies and practical tools needed to mainstream this science-based approach to environmental target setting.
In this report, we present the results of a study exploring how four critical boundaries
- freshwater use
- nitrogen cycle disruption
- land use
- biodiversity loss
can be assessed throughout Alpro’s value chain to be used to set science-based targets.
Some of the most significant boundaries that need to be evaluated for companies that are dependent on agricultural raw materials, such as Alpro, are those directly impacted by agricultural production: land use, freshwater use, nitrogen cycle disruption (e.g. through fertilizer application), and biodiversity loss. In this report, we present the results of a study exploring how these four critical boundaries can be assessed throughout Alpro’s value chain and how the outputs of these assessments can be used to set science-based targets. This work has been carried out by a consortium of partners with active involvement from Alpro itself.
Learning process
WWF-Netherlands initiated this project to advance the necessary knowledge for its One Planet Thinking program, with IUCN-NL participating as a sounding board. The freshwater targets have been assessed using WWF’s favored methodological approach to setting a Context-Based Water Target, executed with support from Good Stuff International (GSI).1 The biodiversity assessment was conducted by researchers from Wageningen University (WUR) and Plansup using the Biodiversity Footprint methodology (BioFP). Baseline impact assessment, exploration of additional methodologies for nitrogen and land-use boundaries, as well as overall project coordination was conducted by Metabolic.
1Broader conversations are ongoing around the possibility of merging the more recent work on Context-Based Water Targets into the Science-Based Target Network. As this is still in progress this work continues to be referred to as Context-Based Water Targets in this paper, hereafter referred to simply as CBWT.
This research represents an important step forward in tackling the complexities of interpreting the global PBs at a level that companies can apply to their own supply chains. Some important outcomes include a deeper understanding of the appropriate scales (temporal and spatial) on which these boundaries should be assessed, and an evaluation of potential for the scalability of these approaches. That said, this work is part of an ongoing learning process, requiring continued and active contribution from private, public, and civil society actors. One of the next steps in this process, as described in Chapter 4 of this report, is to further develop these methodologies so that they can be deployed quickly and at a much larger scale, using automation techniques. Stakeholders who stand to be affected, such as farmers within agricultural supply chains, must also be engaged in the conversation about corporate target-setting and the action plans that it will imply. However, though there are still challenges ahead, the urgency of developing science-based approaches for environmental management is clearer today than ever before.
A new frontier in environmental management
A broad spectrum of methodologies, tools, programs, and action plans have been developed in recent decades to relate human impacts to planetary limits. The PB framework, introduced by the Stockholm Resilience Centre (SRC) in 2009, is currently the most broadly studied and utilized approach (Rockström et al., 2009; Steffen et al., 2015). The framework identifies nine processes that regulate the stability and resilience of the Earth system as a whole (see Figure 1). It then proposes quantitative boundaries within which human and natural worlds can continue to thrive. Crossing these boundaries increases the risk of generating large-scale abrupt or irreversible environmental changes. Out of the nine boundaries, SRC has estimated that we have already transgressed four: climate change, biodiversity loss, phosphorus and nitrogen biogeochemical flows, and land system change.
Planetary Boundaries: a compass for target-setting
To understand the significance of this “boundary-oriented” approach when looking at the current impacts of our economy, we can consider our macro-level performance on just one of these areas: climate change. Despite efforts intended to stabilize and decrease greenhouse gas (GHG) emissions, assessments from the Intergovernmental Panel on Climate Change (IPCC) clearly show that emissions levels have continued to rise. The current trajectory, which has seen an increase in emissions of 31% between 1990 and 2010, puts us on a path towards a projected global average increase of 3.7 to 4.8ºC by the end of this century (IPCC, 2014). This is far beyond the maximum limit of 2ºC that the scientific community has recommended in order to avoid the worst projected effects of climate change. Crossing this limit will result in dire consequences ranging from water scarcity to decreases in agricultural production. The most recent IPCC report recommends an even more stringent goal of 1.5ºC average temperature increase. To have a chance of keeping within this limit, we must stick within a 570 gigatonne budget, which is currently on track to be exhausted by 2030. To stay on target, we need to reduce our annual emissions to about half of their current rate (25-30 Gt/year) by 2030, and eventually reach net-zero emissions around mid-century (IPCC, 2018).

At current rates of emissions, our greenhouse gas budget for staying within 1.5ºC will be used up within 12 years.
Succeeding at this task requires a rapid and dramatic transformation of our economy, with whole sectors and individual organizations within them accepting certain assigned levels of strategic and fiscal responsibility for ensuring this transition. According to data reported to the Carbon Disclosure Project in 2013, 81% of the Global 500 companies had already set GHG emission reduction or energy-specific targets (CDP, 2013). However, until recently only around 5% of companies referred to ecological limits or planetary boundaries in the development of their strategies, and even fewer had based their target-setting on these principles (Bjørn et al., 2017). The result is that most of the targets set by companies were insufficiently ambitious to result in the necessary reductions needed to stay within the global emissions budget.
Science-Based Targets initiative
Recognizing the urgent need to bring corporate commitments on emissions to the necessary level for avoiding catastrophic climate change, WWF conceptualized the Science-Based Targets Initiative (SBTi) in 2013. The program, developed in partnership with the World Resources Institute, United Nations Global Compact, and CDP, helps companies establish greenhouse gas emissions reduction targets in line with climate science. Though not the first effort of this kind, the SBTi has been rapidly and broadly adopted, signaling that the corporate world is beginning to understand the urgent need for the role of science in environmental target setting. This strategy, if implemented by the largest emitters, supported by strong policy, and coupled with the right incentives, has a chance of steering the world onto an emissions pathway that keeps us below the current politically-negotiated 2ºC boundary.
The One Planet Thinking program
With the Planetary Boundaries framework as a compass, it is clear that climate change is not our only point of focus in guiding ourselves towards a sustainable future. According to the bi-annually updated Living Planet Index, we have seen an overall decline of 60% in population sizes of vertebrate species in less than 50 years (WWF – Living Planet Report, 2018). This is one of the many dramatic shifts we are causing through land use change and resource extraction, activities that we must also bring within planetary limits.One Planet Thinking is a business engagement program initiated in 2013 by WWF-Netherlands, Eneco, and Ecofys, with the aim of bringing the impacts of companies within the range of the PB framework, for areas including and beyond carbon emissions. In 2016, the program was expanded across additional WWF Network offices and IUCN-NL. One of the core principles of OPT is that leading companies have a key role to play spearheading the effort to define sustainability targets that are not only safe for the planet, but also contextually-relevant and socially fair, using a combined top-down and bottom-up process. This takes into account existing global and national commitments, comparison of performance against best-practices, dialogue between existing users, and a principles-based framework to define sensible priorities and distributions.
Science-Based Targets Network
The two aforementioned initiatives, as well as various similar efforts that have emerged independently within companies (e.g., those started by Mars, Barry Callebaut, and UPM) point to a clear trend: we are beginning to understand the imperative for setting our targets for environmental impact reduction in line with science. This shift represents a new frontier in environmental management that is likely to become the new standard within companies and potentially for national policy. The recently-established Science-Based Targets Network (SBTN) is currently being shaped to serve as the umbrella organization for the initiatives in this space. Over the coming years, SBTN aims to become a central hub for developing and sharing methodological best practices, and delivering a societal and political mandate for science-based action.
Implementing science-based targets
In order to be able to set and implement science-based targets, we need tools for identifying the critical boundaries in the Earth system, determining how much “impact” the often-moving system is capable of absorbing, and then fairly distributing this impact “budget” among participating actors. Though this may sound straightforward, and has been successfully applied in the case of climate change targets, there are still a number of challenges that need to be addressed before a similar approach can be deployed at scale for most other boundaries. The pilot study with Alpro described in this report, was largely geared at addressing some of these challenges, by further developing and field testing methodologies for boundaries other than climate.

Defining boundaries
Though the PB framework identifies nine boundaries in the Earth system, and proposes potential quantification for seven of them, boundary-setting is far from an exact science. There is still much uncertainty about the specific nature and range of the boundaries that have been defined, the kinds of impacts that are likely to contribute to transgressing the boundaries, and the many complex interactions that occur between impacts and boundaries through feedback mechanisms (Rockström et al., 2009).
Moreover, there is an important distinction to be made between boundaries and tipping points. A tipping point is a zone of non-linear transition in a system, where small changes suddenly add up to create a shift to a radically different new state, a change which is often difficult to reverse. Well-known tipping elements that will possibly be impacted by changes in the Earth’s climate system include: the Greenland ice sheet, the Atlantic thermohaline circulation, and the Indian summer monsoon (Lenton et al., 2008). At certain increases in average global temperature, the probability of sudden transformation in these tipping-points becomes increasingly likely: the Greenland ice sheet could melt (leading to significant sea level rise), the Atlantic thermohaline circulation could be disrupted or halted (leading to a likely dramatic cooling of European climate), and the Indian summer monsoon could be strongly strengthened or weakened (leading to the disruption of local ecology and agricultural practices).
In the PB framework, boundaries are defined a certain distance from the presumed “tipping point”, creating a safety buffer. This is only logical: if we assume that crossing a tipping point will have catastrophic consequences, we should not aim to come as close to the tipping point as we possibly can. A boundary is therefore not an ultimate biophysical planetary limit, nor is it equivalent to a global tipping point (Steffen et al., 2015). Boundaries delimit the safe operating space for society and our actions, i.e., where the risks of serious environmental disruption are considered to be low. Beyond the boundaries, further impacts have an increasing risk of leading to system destabilization. Setting boundaries inevitably becomes open to interpretation, to what we find as acceptable losses and risks.
Some other important considerations to keep in mind when conducting boundary-setting are that the state of knowledge on tipping points is not at full maturity; methods for robustly identifying them are few and far between (Sabag-Muñoz and Gladek, 2017). Furthermore, though some tipping points are indeed likely to be global, as those implicitly identified in the PB framework, there are many more that are known to be regional. For example, apart from the rise of global temperature, localized climatic shifts in the Amazon forest can also be triggered when 40% of the total forest cover is lost, leading to the large-scale conversion of forest into savanna in the southern and eastern Amazon (Borma and Nombre, 2016). These localized effects also need to be considered when setting “safe boundaries” for human activities.
Beyond climate
The climate change boundary is unique in that it is one of the only planetary boundaries that can be said to be genuinely global in nature. It does not matter where on our planet CO2 or other greenhouse gases are emitted: they will make their way into the atmosphere and contribute to global changes in the climate system. So, even though setting targets for climate emissions has been far from an easy process, it is inherently simpler than defining boundaries and targets for inherently localized impacts such as freshwater use and land-system change.
To illustrate some of the challenges of setting boundaries for these context-specific areas, we can consider the complexities of freshwater balance. In some parts of the world, the supply of freshwater is plentiful: there are underground aquifers that recharge regularly, or large quantities of surface water in rivers and lakes and these exceed the demand on this freshwater within a basin. In other parts of the world, the demand within a basin exceeds the available renewable supply of freshwater, resulting in instances of water scarcity. It doesn’t make sense to judge each of these areas equally on how they contribute to global freshwater consumption, as implied by a global boundary. We must consider the local water balance, and understand how that water is distributed across local uses (supporting local ecosystem functions as well as a variety of human uses). For most of the boundaries identified in the PB framework, there are localized and regional tipping points to take into consideration in addition to global-scale concerns. Assessing these requires much more knowledge of localized conditions and dynamics. It also requires a fundamentally different approach to boundary-setting, with much greater spatial and temporal resolution. For instance, due to annual variations in precipitation patterns (as well as changes from year to year), local boundaries for freshwater will actually vary over time.
Properly setting local boundaries for parameters that vary significantly over space and time requires a different set of tools, grounded in geospatial analysis. It also requires a great deal of additional data on local environmental conditions as well as the full complement of impacts from local human actors, so that the “budgets” for resource use can be assessed and allocated between these actors.
The climate change boundary is also one of the boundaries where the target metric (emissions of greenhouses gases) can be directly related to the activities of human actors. Operating fossil-fuel powered machinery will release a predictable quantity of CO2, which can then be directly assessed against the boundary. Though this is true, to a large extent, for context-specific boundaries such as freshwater and nitrogen cycles, it is not the case for more complex boundaries such as land use and biodiversity loss. It is particularly challenging to translate the actions of an individual or company directly into their impacts on the state of biodiversity. Though deforestation will certainly lead to a loss of species, this is not a simple, linear relationship. It matters very much where and how this deforestation is taking place. Converting a parcel of land from natural habitat to human uses will, likewise, have drastically different effects if it is a parcel of land located within a natural area or a parcel located on the edge of an already urbanized zone. Therefore, though some of these boundaries may be expressed in the form of states (e.g., total genetic richness), they must be reliably translated into flows (e.g., number of trees cut) that can actually be related to the activities of companies or other actors. These complexities are some of the core topics we set out to explore through this pilot project with Alpro.
The challenge of allocation
One of the most significant challenges in developing a science-based target is that of allocation. Once we have identified a meaningful boundary (whether on a global, regional, or local scale), and evaluated our current proximity to that boundary, the next step is to assess the extent to which actors in the relevant scope are “using up” the available operating space. If there is operating space remaining, then we must determine how to allocate it fairly among the different actors. Likewise, if the boundary has been crossed, then we must determine the actors’ responsibility to collectively mitigate this transgression.
For example, if we know that we can only safely consume a certain amount of freshwater within a particular sub-basin if we wish to avoid ecological damage, then we need to understand how much water all of the farmers and companies within that sub-basin are currently consuming. From that understanding, “water consumption rights” or “water use reduction responsibilities” must be assigned based on some common principle.
As already discussed, there are many complexities around defining and calculating boundaries to begin with. However, these challenges are primarily of a technical nature and can be solved by acquiring sufficient data and building more accurate models. The challenge of allocation is fundamentally different in that it involves social, economic, and environmental trade-offs and is also inherently a moral question. Should we, for instance, give more impact “budget” to actors who are producing goods essential to human survival, such as food? Should companies who are more efficient at producing valuable outputs get more budget? How should we consider the costs of mitigation? If it is very expensive for one company to change their processes in order to use less water relative to another company, should we ensure that the cheaper solution is taken, even though this might unfairly burden one actor?
The question of allocation has been most extensively discussed in the case of international negotiations on climate change. These negotiations deal with distributing impact rights between nations rather than between actors like companies that often work trans-nationally, which means that many of the lessons learned cannot be directly applied to the company-scale. However, it is useful to consider the allocation principles that have been articulated in the process of these negotiations, some of which may be transposable.
Lucas & Wilting (2018, p.9) defined the six main allocation principles currently used in international environmental negotiations as the following:
- Grandfathering (sovereignty) – involves allocating global budgets based on a country’s current share in global environmental pressure or impact. An underlying assumption is that current technological lock-in and “path-commitment” make it challenging for countries to drastically change their impact profile, which is explicitly recognized by this principle.
- Equal per-capita allocation (equity) – involves allocation of global budgets based on a country’s current and future share in the global population.
- Equal cumulative per-capita allocation (equality and needs) – similar to equal per capita allocation, but based on cumulative population numbers (e.g. 2010–2030).
- Ability to pay (capability) – allocation based on a country’s GDP per capita, with more responsibility for countries with greater wealth.
- Development Rights (capability) – similar to “ability to pay”, in that it uses GDP per capita as a stating consideration, but also takes into account income distribution and prior contribution to climate change.
- Resource efficiency (cost-effectiveness) – allocation based on where the largest and most cost-effective impact reductions can be achieved.
The SBTi has also had to tackle the challenge of allocation basing their approach on a sectoral strategy. The overall GHG emissions budget has been allocated first to specific sectors (based on a combination of different principles and considerations such as efficiency, cost-effectiveness, responsibility, etc.), and then to different individual actors within these sectors.
Allocation of impact budgets for highly localized boundaries should ultimately be conducted in a negotiation process with all local actors in order to be considered valid. A similar process that has taken place for international climate negotiations and other transboundary impacts would ideally be undertaken with local companies, such as farmers and the cooperatives who represent them. This is necessary for social legitimacy and perceptions of fairness. Therefore, though we explore allocation in this study, and propose approaches that seem best aligned with available science, there are some aspects of this step that cannot ultimately be addressed without a political and stakeholder process.
From this brief overview of some of the challenges surrounding the development of science-based targets within the PB framework, particularly those with a strong contextual and temporal dimension, the need for pilots like the one currently described becomes clear. As the science improves, and methodologies are further developed, important next steps will also include non-technical questions surrounding the moral and practical principles of allocation, as well as the engagement of the stakeholders who are part of corporate value chains.

Alpro: Towards a “one planet” brand
Alpro, part of Danone, is a producer of plant-based food and drink products. Its major products are soy and almond drinks, with additional products including rice, coconut, oat, and cashew-based drinks as well as alternatives to yoghurt and cream, desserts, margarines, and ice cream. For strategic ingredients like soy, almonds, and oats, among others, Alpro works in very close collaboration with its suppliers on a range of topics including sustainable production practices.
Alpro’s business model rests on the transition to more plant-based diets, which the company actively markets as “good for the planet and good for your health.” As one of many dimensions of its commitment to sustainability, Alpro has been participating in the One Planet Thinking program and worked with consultancies (eg., Ecofys) to understand its impact hotspots, and current performance on some boundaries for their two main product families (soy and almond).
- Alpro commissioned an assessment on their current and projected future performance (2020, 2030, 2050) on greenhouse gas emissions for the supply chain of soy and almond drink (transport, production, packaging, distribution). Alpro has developed and adopted reduction targets based on the Sectoral Decarbonization Approach of the Science-Based Targets.
- In their current proposal for Scope 3 emissions, under WWF’s Climate Savers Program, Alpro has performed in-depth research on science-based targets for a number of key commodities, when possible based on AFOLU (Agriculture, Forestry, and Land-use) pathways in IMAGE (by PBL Netherlands, University of Aberdeen, and Ecofys).
- Alpro commissioned a current impact assessment for water use in the form of water footprints with regional information. Though they have yet to develop standardized reduction targets, they have been applying methodologies to define these targets on a case-by-case basis.
Table 1 shows an overview of Alpro’s current progress on developing science-based targets for a range of key impact areas. This effort has been largely based on the PB framework and has focused on the most relevant impact areas for Alpro’s supply chain. The actions that Alpro has taken over the years show their pioneering efforts to bringing the company’s entire footprint within the range of our planet’s safe operating space, reinforcing their commitment to eventually offering One Planet products to consumers.

Setting science-based targets for nature: project overview
The goal of the pilot with Alpro, described in this document, was to test out methodologies for setting science-based targets for four planetary boundaries beyond climate: freshwater use, land-systems change, biogeochemical flows, and biodiversity loss. These four areas were selected because of their relevance to agricultural activities and because two of them (biodiversity loss and biogeochemical flows) are among the most severely transgressed planetary boundaries.
Because of the relative novelty of this approach, there are no commonly accepted methodologies for evaluating planetary boundaries at the level of individual companies. As a starting point, this study set out to test WWF’s current potential methodological approach to setting a Context-Based Water Target (CBWT) for evaluating the freshwater boundary, and Wageningen University’s Biodiversity Footprint (BioFP) approach for evaluating biodiversity impacts. Both approaches had to be adapted and further developed in the context of the pilot with Alpro. At the outset, no methods were proposed for the land-use and biogeochemical flow boundary evaluations, which led to the exploration and development of some proposals during the pilot itself.
The project was divided into three sequential phases, which are briefly described below. This report roughly follows the structure of the project, with each phase documented in a separate chapter.
Phase 1
The first phase of the pilot involved a baseline impact assessment of Alpro’s soy and almond value chains. We conducted a generalized Material Flow Analysis (MFA) to understand the resource footprint (primary inputs and outputs) at each step of the chain and to highlight the most impactful areas relative to the four boundaries under evaluation. In addition, we conducted contextual research about the regions under investigation to understand some of the dynamics in these geographies. The overarching purpose of this first phase was to select a set of specific farms or facilities for further assessment in Phase 2. The goal was to identify locations for which we could collect enough data for the subsequent boundary assessment, but also those from which we could ideally generalize most effectively about Alpro’s overall impacts (for example, farms with characteristics most similar to the largest segments of Alpro’s supplier portfolio).
Phase 2
In the second phase of the pilot, we developed the methodologies for determining the boundary for the four selected impact areas (land-use, freshwater, nutrient cycles, and biodiversity), evaluating the degree to which the boundary had been crossed, allocating the contribution of the individual farm’s impact to crossing the boundary, and setting targets for staying within the boundary. These steps were executed separately for each boundary by each of the three teams working on the project. Because the starting methodologies were at different levels of development and the data was not uniformly available across topics, we were able to make more progress on some of the boundary assessments than on others.
Phase 3
The final phase of the project was to provide recommendations for the actions that Alpro can take in order to steer its suppliers towards staying within the identified boundaries. Because this pilot did not assess Alpro’s full supplier portfolio, and because the methodologies tested need further development and review, it is only possible to describe these recommendations in general terms. For each of the boundaries, we consider possible situations in which:
- The boundaries are not transgressed, but general efficiency measures are possible
- They are transgressed, but easily mitigatable through measures within the actor’s scope of control
- They are transgressed, but not easily mitigatable through measures within the actor’s scope of control

Setting science-based targets
Phase 1: Selecting cases
In the first phase of the project we conducted an assessment on Alpro’s almond and soy drink value chains in Spain and France, respectively. Due to some limitations in data as well as some practical constraints in the timeline of the project, most of our attention is centered on the almond supply chain. Here we provide a summary of the material flow analysis results and the initial context assessment.
We obtained the data for the material flow analyses from previously conducted studies by Alpro and its partners, such as LCAs, carbon and water footprint assessments, as well as data from questionnaire surveys. Where values or information was missing, secondary sources were used.
The goal of this phase of the project was to identify farms or processing facilities within Alpro’s almond and soy value chains to use in the development and assessment of boundaries in the next phase of the project. We wanted to identify the activities in the value chain that were most impactful in terms of our selected areas of evaluation (freshwater, land-use, nitrogen cycles, biodiversity,) and partners who could be considered representative of a large part of Alpro’s suppliers.
Almond drink production
Most of the almonds sourced by Alpro are cultivated in Spain, in three different regions in the eastern side of the country. For this assessment we used data from a sample of 12 farms. These 12 almond farms were selected by Alpro as representative farms in their supply chain, and had previously undergone detailed water footprinting analyses, which provided additional data for this phase.
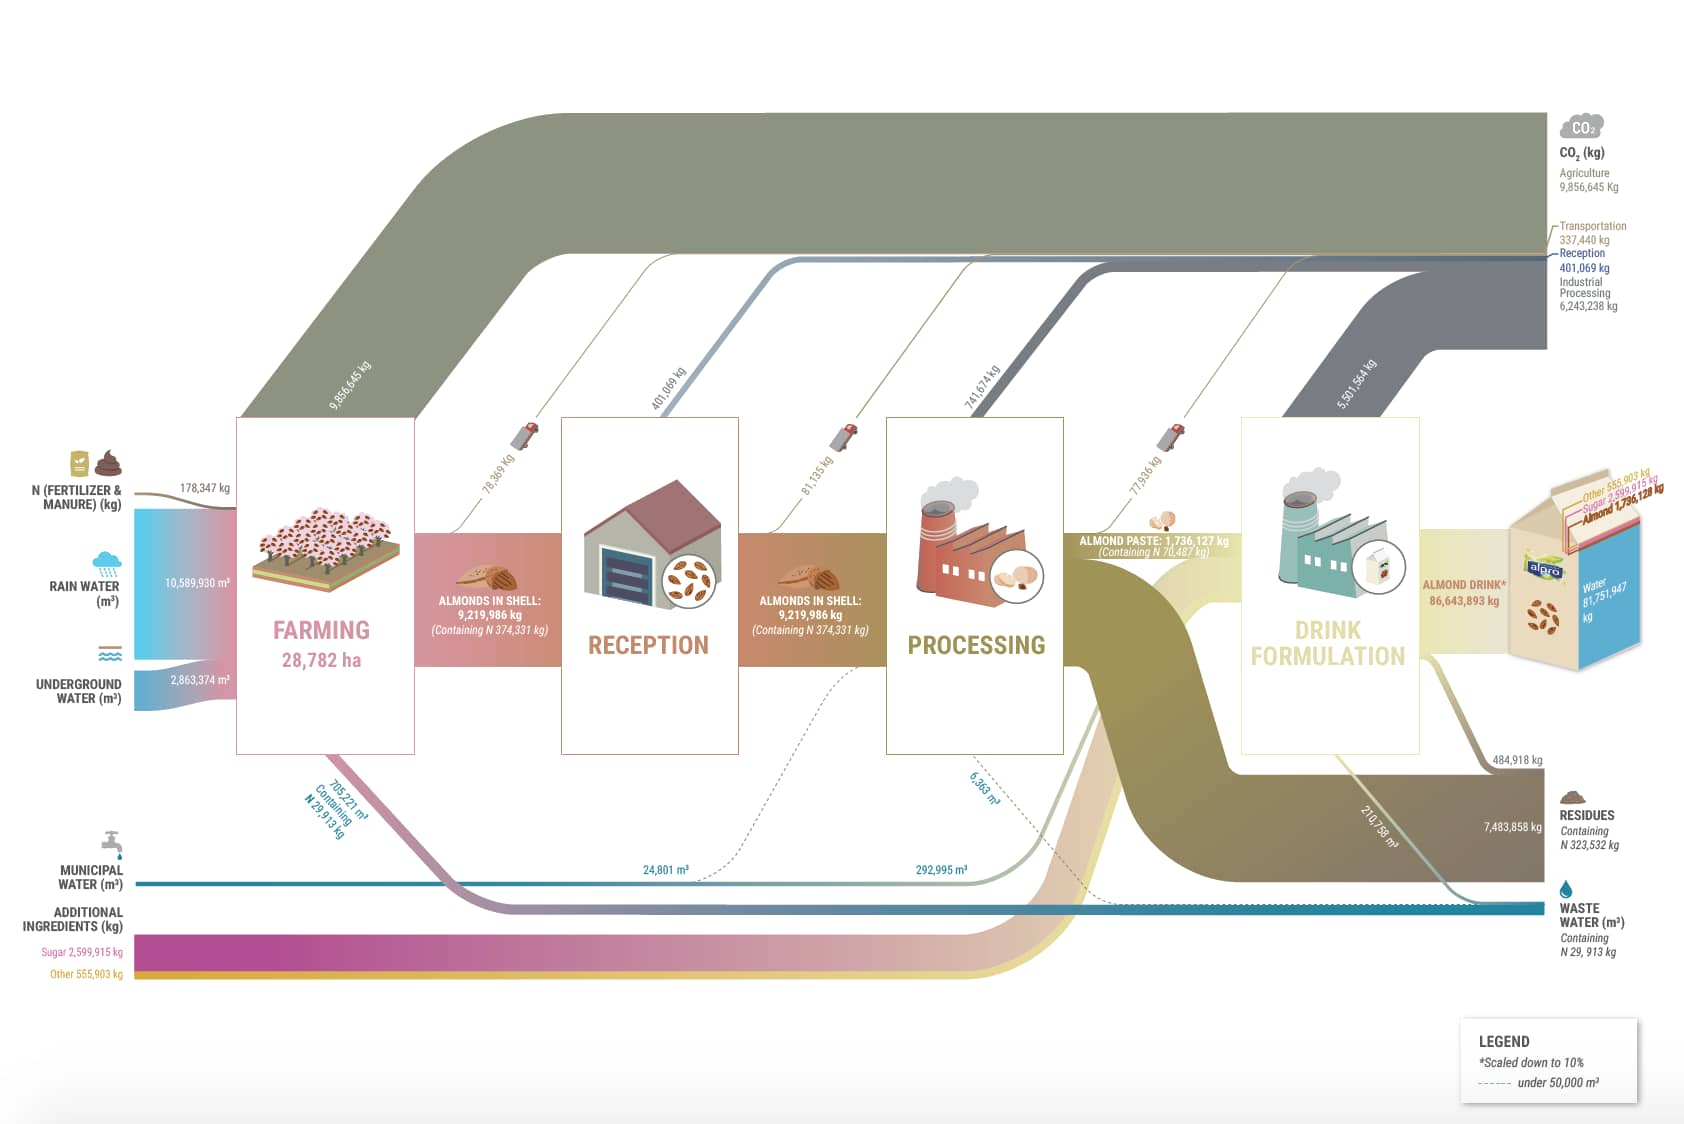
The Sankey diagram on the next page (Figure 2) shows the results of the material flow analysis. Processing of almonds into almond drinks occurs in three main steps: reception of the almonds in shell, dehulling and processing the almonds into paste, and drink formulation. Reception and processing the almonds takes place in Spain, from where the almond paste is transported to drink formulation facilities in the United Kingdom, Italy, and elsewhere in Spain.
Key findings & sustainability risks
- The cultivation of almonds has the highest water consumption in the almond drink value chain and is also the largest contributor to CO2 emissions.
- The use of fertilizer and manure can result in nutrient runoff, where fertilizer nitrates end up in the water system and cause eutrophication. Nitrogen components can also volatilize and contribute to the transport of nitrogen compounds through air, which can lead to changes in terrestrial ecosystem structures.
- Processing generates a large amount of waste residues, amounting to around 81% of the total original almond harvest weight. This consists largely of almond hulls (harvest wastes are not taken into account here due to data unavailability). These hulls are valorized in different ways (e.g. biofuel).
Since the bulk of the environmental impact comes from the cultivation stage, our further analysis focused on farming operations rather than processing methods.
Close-up: assessment of almond farming
We conducted two additional close up material flow assessments to provide insight in the sustainability performance of the selected farms. We categorized the farms into four types, as depicted in the Sankey diagrams. The first diagram below (Figure 3) shows the total inputs and outputs (kg and m3) for all farms in the sample and the second diagram on the next page (Figure 4) shows values per kg of almonds to show the relative performance of the farms. As the impact areas of interest for this study are climate change, freshwater use, land-system change, nitrogen cycle, and biodiversity loss, we selected the input and outputs: fertilizer, water, yields, and carbon emissions.


Key findings & sustainability risks
- Conventional farms without irrigation comprise the largest share of farms in the sample that we assessed and have the highest total inputs of water and fertilizer and the highest total outputs of CO2 emissions and wastewater. Consequently, these farms have the highest impact in the selected impact areas.
- Conventional farms with complete irrigation had the highest impact per kg of almonds on climate change and the nitrogen cycle due to use of fertilizer and pesticides. Impacts on biodiversity are not clear from this analysis.
- The conventional farms with medium irrigation have the highest water footprint. Interestingly, these farms use both more rain and groundwater per kilogram of almonds than the farms with complete irrigation. However, this is likely an artefact of the available data, since there was one farm in this category that had young trees and a consequently low yield (500 kg / ha), resulting in an artificially high water footprint relative to the completely irrigated farms.
- Ecological farms generate the lowest amount of CO2 emissions and have the lowest water footprint as they don’t use any chemical inputs or irrigation. Consequently, they have the lowest impact on climate change, freshwater use, and the nitrogen cycle.
- Ecological farms and conventional farms without irrigation have the highest land-use footprint per kilogram almond production (0.004ha p/kg of almonds).
- Irrigation has a high impact on yield. Ecological farms and conventional farms without irrigation showed yield that were on average 73% lower than from the irrigated farms.
Soy drink production
Alpro sources soy from Canada, France, the Netherlands, Italy, and Austria. For this study, we have assessed a soy supply chain from France (Issenheim). The data received included primary data collected from Alpro and secondary data for cultivation and additional ingredients. The material flow assessment is primarily based on the LCA study performed in 2016. The Sankey diagram below (Figure 5) shows the in- and outputs of all steps of the soy drink supply chain.

Key findings & sustainability risks
- The largest amount of energy is used for drink formulation, namely 76% of the total energy consumption.
- Farming has the largest water footprint (88% of the water consumption) due to irrigation.
- Similar to what is seen in the case of almond production, fertilizer use for plant cultivation can also cause ecological impacts. Soy is a legume, and therefore has the ability to fix nitrogen in the soil. This can reduce the need for artificial fertilizer, but can also potentially add excessive nitrogen to the ecosystem through natural fixation processes (Battye, Aneja, and Schlesinger, 2017).
- The residues from grinding the harvested soy make up around 44% of the biomass coming out of the process and can be processed into other soy food products or animal feed. It is not clear from the data received what the residues and waste are in the farming stage of the value chain.
- Farming and industrial processing emit equal amounts of CO2 equivalent emissions. Of the CO2 equivalents emitted by farming, the largest amount results from farming inputs, like fertilizer and pesticide use. From the processing stages, drink formulation emits by far the largest amount of CO2, resulting from fuel and electricity use.
Context research
Having completed the initial material flow analysis and high-level impact evaluation for the two value chains, we selected a smaller group of farms for the boundary and target assessment based on their geographic proximity to one another. Here we describe the context and specific landscape of the selected almond farms to get a better understanding of their surroundings.
Almond farming in the Ebro Basin
The almond supply chain assessed in the previous section included 12 almond farmers from one of Alpro’s key suppliers, the UNIÓ NUTS, SCCL Cooperative. The cooperative aggregates almonds from farmers located in the eastern part of Spain, specifically in Catalonia (Tarragona, Lleida), Valencian Community (Castellón, Alicante), Murcia, Balearic Islands, Aragón (Teruel), Castilla La Mancha (Albacete). Three farms were selected for an initial assessment of the impacts of different types of farms on this area (referred to as Farms 1, 2, and 3 throughout the remainder of this report). The selected farms are situated north of Bot, in the province of Tarragona, located between the Serra de la Solsida and the Serra dels Pesells ranges. Bot is part of the Terra Alta Region and sits within the wider Ebro river basin. The farms are situated in the Terres de l’Ebre Biosphere Reserve and close to Natura 2000 areas, which are protected nature areas whose purpose is to provide a safe haven for valuable and threatened species and habitats (Natura 2000, 2018).
Terra Alta region
- Part of the Mediterranean Forests, Woodlands, and Scrubs biome.
- Large land areas have been converted for purposes such as agriculture.
- The average annual temperature range for the ecoregion ranges from 10-17ºC and annual precipitation ranges from 350-800 mm.
- Large parts of the farms’ surroundings are protected nature areas.
The Ebro River basin
- The Ebro river basin is one of 25 river basins in Spain which are subsequently divided up into 826 sub-basins that are then grouped in 17 exploitation systems (Ministry of Agriculture, Fisheries Food, and Environment, 2016)
- The Ebro river basin comprises a network of 12,000 km of waterways, rising in the Cantabria Mountains in Northern Spain and flowing east-southeast to the Mediterranean Sea.
- The Ebro river basin drains an area of about 85,000 km2 in northeastern Spain (Milano et al., 2013). The basin captures a mean runoff of 18 km3 each year. In recent years, the mean annual runoff reaching the sea at the mouth of the River Ebro has been about 10 km3/year. The remaining 8 km3/year coincides approximately with the mean annual water consumption in the basin (López & Justribó, 2010).
- The basin is increasingly experiencing environmental issues:
- Oversupply of nutrients from agricultural run-off causes eutrophication of both land- and the water system, which has multiple ecological impacts, like decreased biodiversity, shifts in species composition, and toxicity effects;
- shrinkage or retreat of the delta front, due to decreasing sediment load;
- Subsidence or sinking of the delta because of the surface’s compression;
- the salinization of water and soil as a consequence of sea water entering the delta, due to the reduction of the river flow and strength and decreasing sediment load (De Marcos Fernández, 2016)
- The largest stressor to the water resources is agriculture that uses ground- and surface water for irrigation and discharges wastewater.
- Climate change can potentially enhance the impact of the stress human activities place on the water system. Climate data show increasing temperatures in the Ebro River Basin especially in summer and autumn when also the largest amounts of water are withdrawn, and decreasing precipitation particularly in summer (Lutz & Merz, 2016).
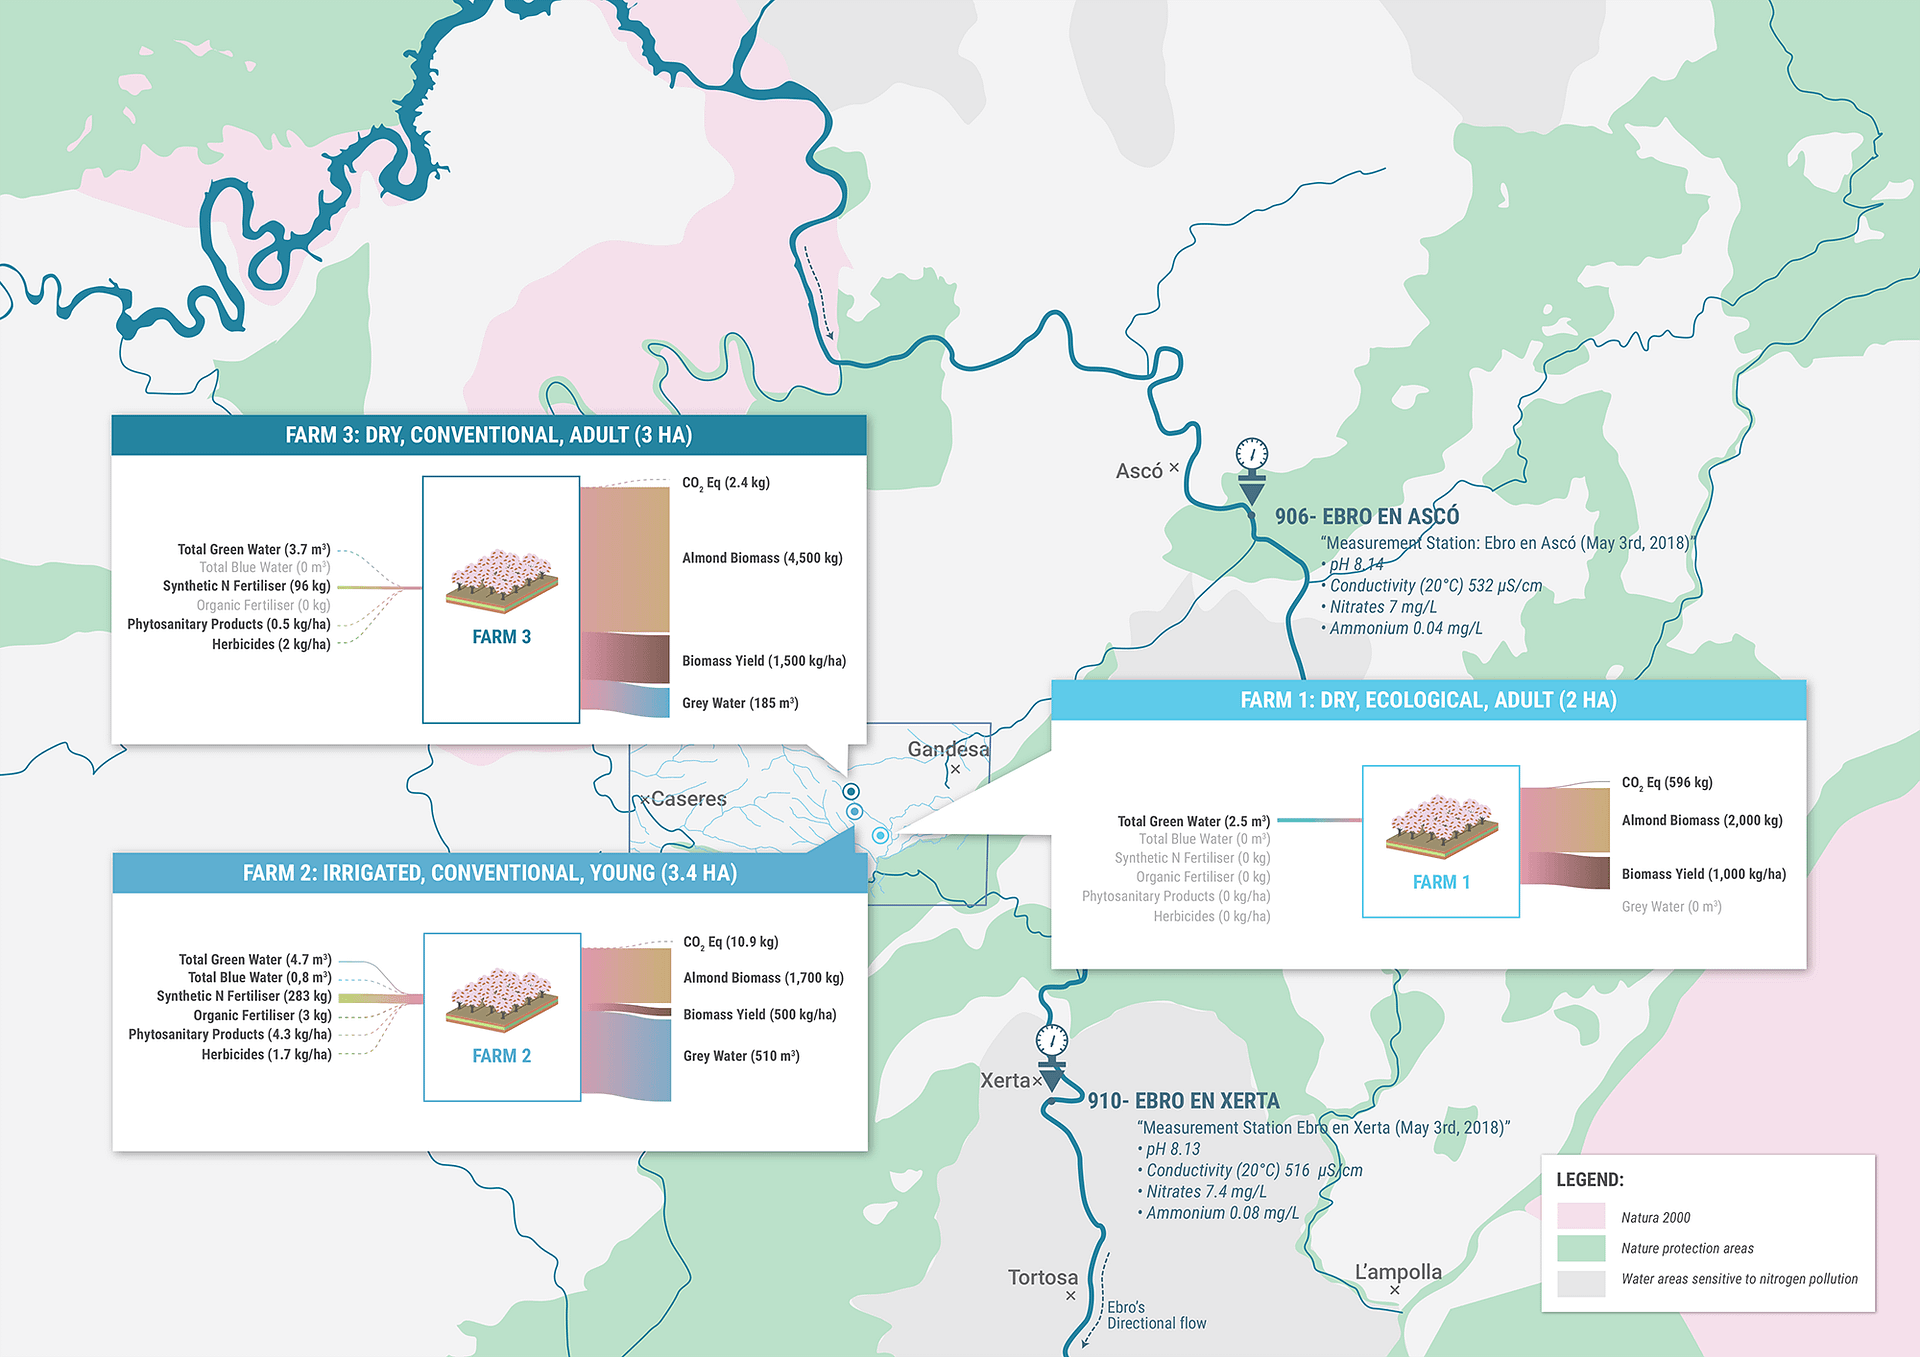
The selected three farms sit within a sub-basin of the Ebro, namely the Rio Canaleta which feeds into the main Ebro river. To get an initial understanding of the impact of almond farms on the environment, the farms were plotted on a map showing the Natura 2000 area and some of the surrounding waterways (Figure 6 on the next page). We included water measurement data from two stations situated upstream (Ebro Ásco) and downstream (Ebro en Xerta) from where the Rio Canaleta joins the Ebro river. Measurements of pH, conductivity, nitrates, and ammonium are displayed on the map, showing data from May 3rd, 2018. The graphic also shows the inputs and outputs of the different farms.
The results of the water measurement stations in Asco and Xerta show that the nitrate levels in the Ebro at the two measurement points (7 and 7.4 mg/L) are higher than the natural levels (less than 1 mg/L) of nitrate and increase downstream. This can indicate that nitrogen is released into the water system by actors that are situated downstream of Ascó, like the almond farms. Yet, from this data we cannot make any assumptions on the contribution of nitrates in the water of the almond farms due to the potential contributions of other actors.
All three farms are located north of Bot and are close to waterways that run into the Ebro. The Ebro runs through the nearby nature protection area. This means that run-off from the farms flows downstream through the nature protection area and could have an impact on the local water quality and availability as well as biodiversity.
Key findings & sustainability risks
- The ecological farm has the lowest emissions and water footprint, limiting its impacts on climate change, water availability and quality, the nitrogen biogeochemical cycle, and biodiversity loss. However, yields per hectare are about 34% lower than yields of Farm 3, raising the question of trade-offs between production and higher environmental values. This is a critical perspective in the context of the growth of organic farming in this area, and is addressed in later sections.
- Farm 2, which is an irrigated farm with young trees, has the highest CO2 emissions per kg of almonds and the highest water footprint. The farm uses a relatively high amount of fertilizer and pesticides for optimal tree growth. Extrapolating from this single example, we can see that an increase in young plantations could significantly raise environmental pressures in the area. However, these impacts are likely to level off as trees mature.
- The conventional farm (3), might be the most representative farm for the cultivation area, with an average yield of 1,500 kg/ha. The farm is not irrigated, but makes use of synthetic fertilizer and pesticides. With a growth of irrigated farms, pressure will increase on the water system that is already stressed at the broader basin level. While the sub-basin has been shown to be within limits, both the quality and flow of water are decreasing downstream in the Ebro river basin.
- Regardless, of the individual impact of the selected farms, it should be taken into account that interest in almond cultivation is growing in Spain, along with global demand. For farmers an intensive cultivation system, with irrigation and the use of fertilizer and pesticides, is most lucrative and a good alternative to traditional crops, such as cotton, cereals, citrus fruits, and olives.

Phase 2: Defining local boundaries & targets
Through the contextual research in Phase 1 we were able to select a set of almond farms in Spain and soy farms in France for further study. The second phase of the project, described in this chapter, comprises the bulk of our research: the definition of boundaries and targets for the four impact areas under assessment: freshwater, nitrogen cycle, land-use, and biodiversity. The Table below summarizes the different impact areas we evaluated throughout this research.
This research is based on desktop analysis only; no further conclusions can be drawn from it other than those within the scope of the research.
Freshwater balance
Efforts to apply the principles of frameworks such as Planetary Boundaries to company efforts to set more meaningful water targets have been around for a few years but there are very few publicly available examples that detail the outcomes of these efforts when applied to real business data. Water is a highly complex resource and as such the focus of this work has been restricted to looking only at quantity and primarily how this can be quantified at a basin scale. It is acknowledged that quality is another intersection point with the operational activities of some companies, but this aspect of freshwater has not been addressed in this work. The current proposed freshwater use boundaries within the Planetary Boundaries framework include a global boundary for freshwater (total consumptive use of blue water and groundwater) and a basin-scale boundary based on the maximum percentage of blue water withdrawn along a river that ensures there is enough water in the river system to avoid regime shifts in the functioning of flow dependent ecosystems (Steffen et al., 2015). This proposed basin-scale boundary is also linked to the concept of Environmental Flows (EF), which defines the level of river flows for different hydrological characteristics of river basins to maintain a fair-to-good ecosystem state (Steffen et al., 2015).
Water is a highly localised natural resource, which should be accounted for when setting a boundary and a Context-Based Water Target. The most likely alignment with the Planetary Boundaries framework is a basin-scale boundary. After assessing the farm locations, we identified the most appropriate spatial scale to undertake a freshwater balance would be to focus in on a sub-basin within the Ebro basin called the Rio Canaleta. Secondly, agricultural activities (such as almond cultivation) usual rely on green water (moisture in soil from precipitation used for evapotranspiration – Hoekstra, et al., 2011). Irrigated farms (such as Farm 2) rely on blue water (freshwater, surface and ground, stored in lakes, rivers or reservoirs – Hoekstra, et al., 2011). Similar to the question of spatial scales in boundary identification, any boundary chosen would need to account for these two types of water use.
Proposing alternative basin-scale freshwater boundaries
As described above, while the current proposed Planetary Boundary framework boundary for freshwater partly accounts for an appropriate spatial scale (basin-level) it does not adequately account for both green (rainwater insofar as it does not become runoff) and blue water (surface and groundwater) and the consumption of water rather than withdrawals. For water to be useful, it needs to be accessible to those who depend on it. Therefore, it is important to focus on water that is removed from a system when assessing the degree to which water is being used sustainably or not. In theory, water withdrawals refer to water that is non-consumptive and is ultimately returned to a system and could be reused (ignoring quality of this return for the moment). Thus, WWF’s current thinking is that water consumption offers a more appropriate indicator to represent a basin-scale boundary, compared to only considering blue water withdrawal.
To provide further context, within The Water Footprint Assessment Manual (Hoekstra, et al., 2011), a water footprint is defined as: “a multidimensional indicator, showing water consumption volumes by source and polluted volumes by type of pollution; all components of a total water footprint are specified geographically and temporally. The blue water footprint refers to consumption of blue water resources along the supply chain of a product. ‘Consumption’ refers to loss of water from the available ground-surface water body in a catchment area. Losses occur when water evaporates, returns to another catchment area or the sea or is incorporated into a product. The green water footprint refers to consumption of green water resources.”
Steffen et al. (2015) propose a basin-scale boundary as the “blue water withdrawal as % of mean monthly river flow [that meets environmental flow needs]”. When defining a water footprint, noted above (per Hoekstra et al., 2011), this proposed basin-scale boundary appears insufficient for the following reasons:
- It ignores consumptive use of water in contrast to the global freshwater boundary (which focuses on withdrawal);
- It implies a global, one-size-fits-all approach to environmental flows for rivers, which research suggests is less than ideal (Richter et al., 2012);
- It does not account for green water consumption within a basin which is arguably the biggest source of water consumption (Rockström et al., 2010), nor does it account for the fact that natural ecosystems are water users themselves, but ones that we need to keep intact. Since agriculture represents 70% of global water withdrawals (90% of consumption) and 60% of global crops are rain-fed, green water use is a critical factor to account for when determining boundaries for freshwater (FAO, 2014);
- Blue water availability often does not fully account for groundwater and/or inter-basin transfers.
The Planetary Boundaries framework simplifies highly complex natural systems using a reductionist and segregated approach to define system boundaries. While this provides an easier cognitive way to visualize these systems it has the potential to encourage siloed efforts to define these boundaries without explicitly making the connections with other planetary systems. To account for these interconnections between freshwater and other domains, this approach uses two different boundaries to create a more comprehensive method to account for both blue and green consumption of water at the basin-scale. As such, this project used two basin-scale boundaries:
- Environmental Flow (which is affected by blue water consumption);
- Natural vegetation land cover (which affects and is affected by green water consumption).

Blue water consumption boundary: Environmental Flow
An Environmental Flow (EF) is defined within the Brisbane Declaration (2007) as “the quantity, timing and quality of waterflows required to sustain freshwater and estuarine ecosystems and the human livelihoods and well‐being that depend on these ecosystems.” This means that it is not appropriate to set a global value for EF, and as such the EF requirements for any given river needs to be assessed at a local scale. Richter et al. (2012) propose a presumptive standard for determining EF for rivers where EF values have not been set. However, even the authors of this work caution against its use as a default and advocate for efforts to be made at a local scale to determine the specific environmental needs of a specific river. Steffen et al. (2015) currently disaggregate the basin-scale boundary (percentage of blue water withdrawals as a function of mean monthly river flow) as follows:
- Low-flow months: 25 – 55%
- Intermediate-flow months: 40 – 70%
- High-flow months: 55 – 80%
While the above considers the temporal nature of the flow of a river, it does not adequately account for the spatial aspects of a river and the unique environmental requirements of the freshwater biodiversity present within a river. As such, where possible, local assessments or determination of the specific EF needs of a river should be used as the boundary when trying to assess the degree to which blue water use is sustainable or not (i.e., freshwater ecosystems have enough water to thrive). These EF requirements then need to be assessed against the actual flow of water within the river on a monthly scale.
Green water consumption boundary: natural vegetation land cover
Water is a renewable resource and one that all living organisms use. While consumptive use by animals is largely inconsequential, the consumptive use by plants is important when determining flows in basins. Native habitats, as well as agricultural crops, are both dependent upon water and are a user of water. Accordingly, one of the challenges facing planetary boundary thinking is how much (land, water, etc.) to allocate (or pre-allocate) to habitats, while also ensuring that crop water use is properly addressed.
In his book Half-Earth: Our Planet’s Fight for Life, E.O. Wilson (2016) put forward an idea that half of the earth’s “representative” surfaces should be preserved in order to preserve biodiversity. This concept is theoretically possible as large fractions of species reside in relatively small areas – for instance 85% of plant species can be found on just a third of the earth’s land surface. Wilson suggests that if humans set aside a “representative” 50% of the land’s surface, it may be possible to preserve up to 85% of its species. Many have started to test this theory (Pimm et al., 2018). What is still missing is a way to meaningful assess and model the effect of green water consumption within a basin. This is important as a way is needed to identify and assess the impacts caused by green water consumption by non-natural vegetation, since changes in green water flows reduce runoff and groundwater recharge, and therefore reduce the long-term availability of blue water within a basin.
With this concept in mind, land use by natural vegetation could present a potential indicator that can assess the sustainability of green water consumption within a basin. By including this indicator into the assessment of freshwater sustainability, we can measure how the assessment accounts for the needs of natural green water consumption as part of the hydrological system, where the bulk of water consumption occurs. This observation is acknowledged by one of the leading authors of the Planetary Boundaries (Rockström) who notes that globally approximately 7,100 km3 of water is consumed globally by agriculture annually, of which 5,500 km3 is consumed by rainfed agriculture (Rockström et al., 2010).
Using these two indicators in combination allows for a more complete assessment of whether the consumptive water use within a basin is sustainable or not, and also ensures that the freshwater needs of nature and ecosystem services remain firmly at the center of any assessment of freshwater sustainability at a basin scale.
Setting the boundaries
Ahead of setting the boundaries, some of the key insights from the freshwater balance analysis within the Rio Canaleta were:
- Precipitation within the Rio Canaleta for 2017 was roughly 35% lower than expected during an average year, and the summer dry-period commenced earlier than normal, beginning in April;
- The main consumption of renewable water within the Rio Canaleta during 2017 came from natural vegetation evapotranspiration (+/- 73% of the total water use);
- Agricultural evapotranspiration was the third highest source of water consumption within the Rio Canaleta in 2017 – roughly 17% of the total water used;
- Within agricultural water use, the cultivation of nuts, vineyards and olives was estimated to account for about 96% of water consumption (44%, 30%, and 21% respectively) (Appendix B1);
- Overall, the assessment appeared to indicate that there was negative water balance within the Rio Canaleta during 2017 which might have resulted in the system needing to draw on its soil moisture and shallow groundwater reserves to support the water use needs of the basin. However, most of this is likely to have been used by natural vegetation rather than human activities.
- Applying the proposed theoretical new freshwater boundaries to the assessment (and without wider stakeholder consultation & engagement), it appears to indicate that for both blue and green water, the use of freshwater within the Rio Canaleta sub-basin may be within these “sustainable” boundaries, however, the period between May and September in most years is likely to present the most risk of being “unsustainable.”
Environmental Flow
In the case of the Rio Canaleta sub-basin, there are no formal EF values for the river within the river basin management plan (Confederación Hidrográfica del Ebro, 2016). However, there has been some work on developing preliminary technical proxy Environmental Flow calculations for the Rio Canaleta River based on hydrological models which vary monthly in a typical year between a low flow of 0.037 m3/s (August) and a high flow of 0.084 m3/s (May) (Confederación Hidrográfica del Ebro, 2016a). There is also currently no recording of actual river flow within the Rio Canaleta. Therefore, even if formal EF values were available for the river it would not currently be possible to assess if EF values are being met using river flow data.
In the absence of this information, we plotted the modelled runoff within the Rio Canaleta for 2017 against the proxy EF calculation mentioned above to ascertain the potential gap between the two (Figure 7). Due to the lack of an in-river flow meter, the above assumes that runoff is equivalent to flow within the Rio Canaleta. In this assessment, there are only two periods during 2017 (April and December) when the river flow is less than the proxy EF values and these could be considered a breach of the basin-scale boundary.


Putting these sub-basin observations into a wider context, formal EF values have been set for the main Ebro river downstream from where the Rio Canaleta river joins (Tortosa gauging station) (Confederación Hidrográfica del Ebro, 2016). In Figure 8, an analysis of the flow data within the Ebro river at this station against these EF values indicates there has only been one instance (March 2012) where EF values have not been met between 2011-2017 (Confederación Hidrográfica del Ebro, 2018).
In the absence of actual flow data from the Rio Canaleta river and formally agreed EF values for the Rio Canaleta, and as it appears EF values are largely being achieved downstream in the Ebro river, we could (with assumptions) infer it is possible that EF requirements within the Rio Canaleta may be met and if this could be conclusively shown with instream flow data it could be considered to be to be sustainable and within the proposed boundary of environmental flows as proposed in this paper.
Natural vegetation land cover
The Rio Canaleta sub-basin covers an area of 136 km2. To quantity the land uses within the sub-basin, GSI obtained the most recent data for 2017 from the System of Geographical Information on Agricultural Parcels (SIGPAC) which shows all the land uses, agricultural and non-agricultural, within a given area (Generalitat de Catalunya, 2017). Two other sources of data were considered (Corine Land Cover 2012 for Spain and SIOSE 2011 for Catalunya databases), but were deemed to be outdated and were not included in the assessment. Using this data, land use was broadly categorised into four land use types, as shown in Figure 9.

In the case of the Rio Canaleta, over 73% of the land is in a “natural” state and green water consumption by terrestrial (or natural) vegetation accounts for roughly 73% of the renewable freshwater within the system. However, no work was done to understand if this land use is “representative” of what was historically the natural landscape within the Rio Canaleta (i.e. if wetlands accounted for a percentage of the basin and now all the wetlands have been drained and converted into farmland). As such, if we were using this indicator to infer a degree of measurement of sustainability within the Rio Canaleta sub-basin, we could infer that the green water consumption within this sub-basin may be within the sustainable limits, as proposed by the new freshwater boundaries within this paper, since more than half of the land is still used by “representative” natural vegetation and is therefore is within the proposed boundary of natural vegetation land cover.
Allocation
Where assessments show that a boundary has not been exceeded, we recommend regularly assessing basin levels, since water and its use are dynamic. When boundaries are exceeded, farm specific allocations need to be determined in order to set a Context-Based Water Target.
Despite the two proposed boundaries (environmental flows and natural vegetation land cover) in the Rio Canaleta not being exceeded, the freshwater balance data was used to conduct desktop testing of two potential approaches to allocation of freshwater, namely: percentage use of remaining land and contribution to GDP. These desktop tests highlighted that both approaches benefited and disadvantaged different economic sectors in different ways. In addition, application of a single allocation lens did not adequately account for broader Nexus trade-offs, since issues like food security go beyond just economic development.
As such, future work should develop an allocation approach in a slightly different way within each economic sector. This would account for agriculture and the composition of crops that are feasible within a basin to optimize various factors (e.g., GDP, employment, food security, etc.), while simultaneously respecting basin boundaries. This work would need to consider how these sectoral allocations could then be scaled back up to ensure that overall allocations within the basin still result in a sustainable outcome for water use within the basin. This approach has the potential advantage of removing the need for users of the methodology to consider Nexus trade-offs that are beyond their ability to influence. It also avoids, in the short term, pitting one sector against another and always pointing the finger at agriculture, which is likely to be the largest consumer of water, but often the lowest economic value generator (per m3 of water consumed).

Setting targets and recommendations
As mentioned above, the assessment of freshwater balance within the Rio Canaleta did not appear to exceed the proposed basin-scale boundaries, which also provides valuable insights. At this stage, further developing farm-level Context-Based Water Targets would not be necessary for these farms.
However, despite the recommendation that a CBWT is not appropriate for the farms at this point in time, it does not mean that no further actions can be taken by the farms or Alpro. In Table 3 (on the previous page) are a series of recommendations for both the farms and Alpro based on the outputs from the Rio Canaleta freshwater balance.
Discussion / Key Conclusions
Undertaking this basin-scale freshwater balance has identified potential future research avenues that would be useful to explore in order to improve any application of this thinking in a CBWT methodology. The full details of the lessons learnt from this work on Freshwater balance will be collated in a separate standalone report. Highlights of these lessons and areas for potential future research are outlined below:
- Refinement of an approach to identify land use at a basin-scale land use (and land use sub-types) that enables a more meaningful assessment of the sustainability of green water use within a basin;
- Further investigating how water imports (or inter-basin transfers) are dealt with within the water balance methodology and the measurement of groundwater consumption within a basin;
- Developing an economic-sectoral approach to allocations and how this can be scaled back up to a basin-level allocation, as well as how this impacts Nexus issues;
- Standardizing how assumptions are documented and water balances are developed across basins when each basin presents infinite variables to be considered and accounted for;
- Incorporating groundwater recharge into the “drop” diagram and redrafting the diagram to be more representative of the distributions of each water use type using global data;
- To calibrate and set SBT for freshwater balance, local flow gauges are likely necessary, as is detailed land use data and distributed socio-economic data. The availability of remotely sensed ET data and other data could help calibrate values and create more accurate targets;
- Better accounting for temporal dynamics of water availability since precipitation combines within baseflow to create “blended” water availability (e.g., 1/3 precipitation, 1/3 from last month, 1/3 from last year);
- Native habitat is treated as homogenous at present, but this does not likely account for sub-habitats (agriculture often converts certain types of native habitat that are well suited to farming – e.g., rich, well drained soils). Approaches for determining historic “representative” land uses within a basin in order to determine if the natural vegetation within a basin is in fact representative.
Work is still ongoing to develop a scalable CBWT methodology that will enable companies to set a meaningful and credible CBWT that aligns with the Planetary Boundaries framework. Until such time, companies can begin preparing themselves to better integrate this type of methodology by setting contextual targets. All too often the water targets that companies set have no link or alignment with the shared water challenges present in the surrounding basin. Contextual targets focus on the right things in the right places (e.g. efficiency in a water scarce environment or effluent quality where quality is an issue) and adjusting the level of performance of the targets proportionally to the severity of the challenge. Contextual targets do not result in direct contributions to creating more “sustainable” freshwater systems (like a CBWT does) but they do begin to help focus business attention on the right freshwater challenges and begin to identify where deploying a CBWT in the future may offer more strategic business value.
Nitrogen
One of the nine planetary boundaries described in the PB framework is biogeochemical flows. Through it, we can evaluate the severity of anthropogenic changes in the cycles of nitrogen and phosphorus, both of which are essential agricultural nutrients. Most human-caused disruptions to these nutrient cycles result from the application of fertilizers. The problematic effects of excess nutrients in soil and water are numerous, and many play out at a localized level. For the purposes of this pilot, we have focused exclusively on nitrogen, though target setting for this boundary should ultimately also include phosphorus.
When interacting with the natural world, a surplus of nitrogen causes a series of negative impacts on a range of scales, from local to global. Figure 10 outlines these impacts, ranging from highly localized impacts such as nitrogen deposition to global impacts such as climate change. Ideally, a nitrogen boundary framework would include a limit for each of these scales and set local targets for farms in such a way that all boundaries are kept within the “safe operating space”; in other words, taking the most stringent boundary as the guideline for target setting. Our pilot outlines a framework for analyzing boundaries and targets for two of these categories: nitrate/nitrite deposition on the land surrounding the farms and freshwater pollution on the basin level. Further analysis should account for other impact categories at different scales, including, for example, coastal dead zones at a regional level.
During this pilot project with Alpro, we defined a simplified methodology for assessing both a farm-level and a basin-level nitrogen boundary and evaluating the contribution of individual farms to the transgression of that limit. We explore the implications of how the nitrogen emissions “budget” can be divided among farms in a single watershed and approximate what targets for sufficient fertilizer reduction could look like for one of the farms in the Ebro basin, from which Alpro is currently sourcing almonds.
Defining a farm-level boundary for nitrogen emissions
Nitrogen has significant impact on aquatic and terrestrial systems. High amounts of nitrogen in waterways lead to eutrophication, resulting in loss of species diversity. For terrestrial systems, nitrogen represents a limiting factor in plant growth (Vitousek et al., 1997), which has led to some plant species becoming adapted to nitrogen-poor soils (Bobbink et al., 2011). Therefore, excessive nitrogen application favors certain plant species, resulting in altered ecosystems and reduced biodiversity (Vitousek et al., 1997; Ochoa-Hueso et al., 2011).
The process of creating a boundary for nitrogen is complex, since it requires knowledge of local nutrient application and biogeochemical processes. Nitrogen enters an ecosystem through both natural and anthropogenic pathways. Inflows of nitrogen come from a variety of inputs, including food, feed, and fertilizers, and also naturally through nitrogen fixation and deposition (Lassaletta et al., 2012). Nitrogen is stored within an ecosystem in perennial vegetation, soil, groundwater, and sediments. It leaves an ecosystem through crop and livestock harvests, runoff, denitrification, and atmospheric volatilization. Nitrogen within a defined area is continually shifting between states of stock and flow, which allows us to create a boundary for nitrogen levels during a set time frame.
To provide some temporal and spatial context for nitrogen flows within the Ebro river basin, Lassaletta et al. (2012) estimate that around 5,200 kg N/km2 enter the Ebro basin each year. Approximately 50% of this amount is in the form of synthetic fertilizers, 33% as food and feed, 15% by nitrogen fixation, and 7% by deposition of oxidized nitrogen. The nitrogen outputs via river runoff from the Ebro basin are estimated to 390 kg N/km2. The gap between in- and outputs indicates a high nitrogen retention/elimination rate of 92% compared to other European catchments (50-82%), primarily due to the high amount of irrigation channels and reservoirs in the catchment (Lassaletta et al., 2012). Nutrient concentrations in the Ebro river have decreased since 1994, when multiple water treatment stations were constructed (Torrecilla et al., 2005). The Ebro river shows strong seasonality in terms of flow quantity, an issue that is affecting nitrogen concentrations and eutrophication in the Ebro basin. Torrecilla et al. (2005) describe nitrogen concentrations in the high flow seasons (December-April) to be diluted, resulting in low concentrations. During the low flow seasons (June-October), dilution is much lower leading to higher nitrogen concentrations and symptoms of eutrophication. While we used this assumption to calculate the nitrogen boundary, we recognize that nutrient runoff is more likely to occur during high precipitation months, which is reflected in the data collected for the biodiversity footprint boundary section. However, excessive irrigation can cause nutrient runoff even during low flow months. More empirical data on the correlation between precipitation, runoff, nitrogen concentrations, dilution, and irrigation will better inform farm-level recommendations.
Setting the boundaries
Existing frameworks for setting farm-level nitrate emissions limits, such as the European Nitrates Directive (European Commission, 1991), use a static and generic nitrate value that is not related to local ecosystem conditions. However, we know that local conditions influence the amount of reactive nitrogen transferred from the farm to the surrounding environment. Therefore, a farm-level boundary for nitrogen inputs will change based on the surrounding ecosystem and its ability to tolerate and respond to nitrogen inputs. A more dynamic and context-based approach is needed to assess whether local emissions are crossing any local tipping points with regards to eutrophication and other adverse effects.
To do this, we first need to identify a nitrogen boundary that is appropriate for each of the identified spatial scales. For terrestrial ecosystems, we explored defining a boundary for ecosystem areas directly next to the farms to calculate nitrogen deposition. For aquatic ecosystems, we defined a boundary on the basin level to calculate nitrogen concentrations over time.
Terrestrial ecosystems
Bobbink et al. (2011) studied ‘critical loads’ for many ecosystems. A critical load for nitrogen describes the nutrient level where negative effects begin to occur on ecosystem structure and function (EEA, 2010). For the terrestrial ecosystem type most similar to the Ebro river basin, Bobbink et al. (2011) determine a nitrogen boundary between 20 – 30 [kg N / (hectare * year)] as a critical load level. This critical load level is most applicable to farms that are located next to natural ecosystems, since the actual farmland will likely have higher nitrogen concentrations for agricultural production, but may affect surrounding ecosystems. Concentrations above this critical load level result in a “change in plant species richness and community composition” (Bobbink et al., 2011, p. 15).2 Increased nitrogen levels negatively impact soil quality and species richness in terrestrial ecosystems (Bobbink et al., 2011). We therefore used 20 – 30 [kg N / (ha * y)] as the range for medium and high boundary tipping points for the land area surrounding the selected almond farms.
2 We identified “Maquis, arborescent matorral and thermo-Mediterranean brushes” as the ecosystem type most similar to the agricultural region of the Ebro basin.
Aquatic ecosystems
For aquatic systems, boundaries are expressed in nitrogen concentrations at a set point in time (e.g. mg / L) rather than space-related rates (e.g., kilogram / (hectare * year). Based on a literature scan, we determined the range of maximum total nitrogen (TN) concentrations to be 0.8 – 5 mg TN / L (Laane et al., 2005; Liu et al., 2013). Above this level of nitrogen, aquatic systems are at increased risk of eutrophication, resulting in algal blooms and hypoxia (Liu et al., 2011). We used these boundaries as the low and high threshold for TN concentrations in the Ebro river basin. For context, the average natural concentrations of total nitrogen in global rivers is between 0.36 – 1.5 mg TN / L (Meybeck, 1982; Franke et al., 2013; Liu et al., 2013). Furthermore, we know from the water testing stations in Phase 1 that the total nitrogen concentration downstream from the selected almond farms is 1.67 mg TN / L [(7.4 mg nitrate-NO3)/(4.427)], measured in May 2018. This indicates that farms within the Ebro river basin may be operating outside the regional boundary for nitrogen, but we still need to scale down to the farm level to see how individual actors may be contributing to the nitrogen surplus.
While this boundary only considers aquatic impacts at the basin level, further analysis should also create a boundary for impacts further downstream, for impacts at a larger scale such as coastal algal blooms and hypoxic dead zones. While a farm may not be transgressing a boundary on the local scale, the activities could cause impacts on the regional or global scale. If this is the case, the local nitrogen boundary should be adjusted to ensure the larger scale problem doesn’t occur. When comparing boundaries at different scales, the most stringent boundary that is first to be crossed should take precedent.
Basin and farm-level nitrogen boundary calculations
Calculating farm-level nitrogen boundary requires an understanding of the type and quantity of fertilizer applied on the farm, the local rate of natural nitrogen deposition, the rate of nitrogen uptake for the selected crop type, and monthly precipitation rates. Using this information, we can calculate the amount of nitrogen transfer to terrestrial and aquatic ecosystems. A schematic of this nitrogen system is seen in Figure 11.

For the purpose of the pilot with Alpro, we put this framework into practice by analyzing one almond farm in the Ebro river basin. We selected Farm 2 as the example farm, since, out of the three farms selected for closer evaluation, this is the only one applying synthetic fertilizer (283 kg of fertilizer each year on 3.4 hectares, or 83.2 kg N / ha *y). It also has an estimated nitrogen surplus. For additional context, Farm 2 is a younger farm with a lower yield compared to other almond farms in the cooperative. By applying the framework to this farm, we can demonstrate the necessary scenario analysis that can be used for setting nitrogen boundaries for other farms in the basin. As discussed later in the biodiversity chapter, some of the other farms appear to be operating under an estimated nitrogen deficit. This deficit could result in lower yields, which could lead to more land required for almond production. Therefore, it is important to keep all the boundaries in mind when making management decisions, and also to understand the trade-offs between different boundaries.
Basin-level aquatic nitrogen boundary calculations
Through fertilizer inputs, Farm 2 applies 83.2 kilograms of nitrogen per hectare each year [kg N / (ha * y)] (Appendix A1). Based on additional contextual data collected from the farming cooperative (regarding intercropping practices), we assumed the selected farm had no plants contributing to nitrogen fixation. The almond farm is 3.4 hectares large and produces 500 kilograms of almonds per hectare. Assuming a 4.95% nitrogen content in almond fruits (midpoint calculated from Yada, 2011 & Niederholzer, 2013) and a vegetative tree growth nitrogen uptake of 33.6 kg N / ha * y (Brown, 2013), we can calculate the almond production process will require 58.35 kg of nitrogen uptake / hectare each year. We next need to calculate the amount of nitrogen escaping to the air through volatilization (NH3) and denitrification (N2O). Using a context-based methodology outlined by Brentrup et al. (2000), we can estimate that 1% of the nitrogen applied will be lost through volatilization, or 0.832 kg N (Appendix A1, Table A1.1). Denitrification is calculated by multiplying the remaining nitrogen following volatilization by an emissions factor of 0.125, as outlined in Brentrup et al. (2000) and Bouwman (1995), resulting in 1.03 kg N. After removing 0.832 kg of nitrogen per hectare from volatilization (NH3) and 1.03 kg of nitrogen per hectare from denitrification (N2O), this farm has an estimated nitrogen surplus in the soil of 23 kg N / ha * y (Step 5). This surplus nitrogen amount is used to calculate nutrient runoff into waterways. Note that background nitrogen deposition from air is not directly added to the nitrogen surplus in soil, since this is used as a factor to calculate the nitrogen leaching and runoff rate (Franke et al. 2013). See Appendix A1 for calculations.
Next, we wanted to see which months of the year have nitrogen loads above the identified boundary, based on timing of fertilizer application and monthly precipitation rates. Assuming the surplus fertilizer is distributed according to recommended monthly nitrogen application rates (Haifa, 2017), we can calculate the farm’s contribution to aquatic nitrogen levels using monthly precipitation data and location-specific runoff rates. For the purposes of this exercise, we assume that all 41,000 km2 of agricultural land in the Ebro river basin has the same amount of nitrogen surplus and runoff as Farm 2. While we recognize this is an unrealistic assumption that does not account for other crop types or mature almond cultivation, this provides a simplified framework for understanding whether the selected farm is operating beyond local nitrogen boundaries, momentarily avoiding the additional complexities of impact allocation between all local farms. Franke et al. (2013) provide a method for calculating a location-specific nitrogen leaching and runoff rate, accounting for farm-level characteristics such as soil properties, nitrogen deposition, and precipitation. We adapted this method to calculate a monthly range of nitrogen leaching rates assuming the best-case nutrient management scenario. We calculated the monthly Ebro river basin total nitrogen concentration using water runoff and consumption rates from Fabre et al. (2016), and we overlaid the monthly nitrogen concentrations to the aquatic boundary of 0.8 – 5 mg TN / L. Results are shown in Figure 12.
In Figure 12, we show the results of our scenario if all farms in the Ebro basin (41,000 km2 of agricultural land, from Lassaletta et al., 2012) had the same fertilizer input and nutrient management plan as the selected farm. For several months of the year under this scenario, the nitrogen concentration in the water would surpass the high-end boundary of 5 mg TN / L. These results suggest the farm should adjust its nutrient management practices to stay within basin-level nitrogen boundaries, particularly for months with high nitrogen application and low water flow months.3
3 Note: We assume that 100% of the nitrogen leaching-runoff ends up in the river water. This method ignores potential denitrification between the farm and surface waters, potentially giving a high-end estimate of nitrogen concentration.
Local-level terrestrial nitrogen boundary calculations
Similar to the aquatic boundary, the terrestrial boundary for nitrogen requires a local analysis, including the rate of nitrogen deposition and volatilization for the region. In the Ebro river basin, the background nitrogen deposition is estimated to be between 6 – 12 kg N / (ha * y) (Franke et al., 2013; Cleveland et al., 2013). Given the rate of volatilization and area of this farm, an additional 10 kg N / ha may be deposited on the land surrounding the farm (Brentrup et al., 2000; Pinho et al., 2012), reaching the nitrogen critical load (Bobbink et al., 2011). See Figure 10 to see how farm-level volatilization and deposition, combined with background nitrogen deposition, contributes to nitrogen levels in surrounding terrestrial ecosystems. This combined nitrogen deposition would result in a total deposition of between 16 – 22 kg N / hectare, which in some places would surpass the critical load of 20 – 30 kg N / hectare. Therefore, nature areas close to the farm may be negatively affected. (See Appendix A1 for more detailed calculations).4
4 Note: Further analysis should account for variability in local conditions such as wind, rain, and landcover for a more accurate estimate of distributed nitrogen from volatilization.
Allocation
In this exercise, we have evaluated two different nitrogen boundaries: 1) nitrogen deposition per hectare in the immediate vicinity of the farm and 2) aquatic nitrogen concentrations in the river basin.
For the nitrogen deposition per hectare, there is no need to allocate the responsibility of the impact among different actors. The owners and operators of Farm 2 are fully responsible for the amount of nitrogen they apply and any localized effects that may be caused by excessive fertilizer. As we have shown here, the terrestrial nitrogen deposition at Farm 2 is potentially transgressed – reaching levels of up to 22 kg N / hectare, which overlaps with the critical load range of 20 – 30 kg N / hectare. However, our results showed a range of nitrogen deposition (16 – 22 kg N / hectare), the lower end of which does not cross into the critical range. Based on our general model (which still requires refinement and empirical verification), it is likely that Farm 2 would need to slightly reduce its nitrogen application to stay below the critical range, at least on some parts of the farm.
Allocation becomes theoretically necessary when we consider the aquatic ecosystem nitrogen threshold. For this parameter, the individual actions of all the different farms in the water catchment area collectively contribute to increased nitrogen concentrations in the basin waterways. As described earlier in this section, total nitrogen levels in the Ebro river measured downstream from Farms 1, 2, and 3 are higher than the maximum concentrations recommended in some literature sources (Laane et al., 2005). The measured 1.67 mg TN / L is significantly higher than the 0.8 mg TN / L that we have used as the low nitrogen boundary in Figure 12, though it is lower than the high boundary benchmark.
This suggests that, collectively, the agricultural activities taking place in the watershed are leading to an excess of nitrogen that may be crossing localized boundaries in at least certain months. To properly allocate responsibility for this excess nitrogen load, we would need to understand the degree to which all actors in the water catchment area are contributing to nitrogen runoff, using the same kind of model as we have applied to Farm 2 (and ideally supplementing this with more empirical data). Each farm’s contributions to overall nitrogen runoff will vary based on individual practices, such as the timing of fertilizer applications relative to rainfall. Some farms may be contributing a great deal to nitrogen surpluses, whereas others may not be contributing at all. As already mentioned, and discussed later in the section on the biodiversity footprint, there is reason to believe that some of the farms in the Ebro basin are actually operating on a nitrogen deficit and could stand to increase their application of fertilizers.
A full understanding of the degree to which different farms are contributing to the runoff of excess nitrogen provides the starting basis for allocating responsibility for impact reduction, but there are additional complexities to keep in mind. It is potentially relevant to consider, for example, whether farms should have different emissions allowances based on their individual efficiencies and practices. Differentiated budgets could take into account indicators such as:
- Total agricultural yield per unit of nitrogen applied;
- Total nutritional output per unit of nitrogen applied (measured per hectare in calories, protein, carbohydrates, or another set of nutritional metrics).
These indicators could serve as proxy metrics for evaluating:
- Whether the farm is growing crops that are actually suitable for the region and its soil type (better-suited crops will potentially produce greater yields with lower nitrogen application);
- The farmer’s skill in managing his or her farm (good horticultural practices should result in higher yields even when controlling for fertilizer input);
- The overall societal value contribution of the crop in question (to what extent is this crop efficiently providing essential nutrition in this particular geography?).
These metrics could be used to develop a complex allocation approach that would distribute nitrogen emissions rights between farms (and any other nitrogen emitters) in a single water catchment area with an eye on their relative value contribution. Developing such a complicated approach would require many value judgements, assumptions, and active dialogue with key stakeholders.
However, there is another, more straightforward pathway to consider in the case of nitrogen. Because of the degree of harm caused by excess reactive nitrogen in the environment, we may posit that there should ultimately not be a nitrogen emissions “budget” at all. If we accept this principle, then any farm that is contributing to excessive nitrogen deposition and nitrogen runoff should adjust its practices to ensure that this release of excess nitrogen is not happening. This effectively eliminates the need for allocation by saying that all farms have an individual emissions budget of zero.
Our approach in this pilot, of extrapolating the behavior of Farm 2 in the basin, though crude, is intended to help identify the farm’s “individual nitrogen surplus.” We can see from our modeled results that if all actors in the water catchment area behaved as Farm 2 is behaving, the concentration of total nitrogen at the test site in the Ebro would likely be much higher than its current measurement of 1.67 mg TN / L. Using this identified nitrogen surplus, we are then able to set a theoretical target for how much Farm 2 should reduce its emissions.

Setting targets
As discussed in the previous section, since reactive nitrogen has such a strong negative impact on terrestrial and aquatic systems on both a local and global scale, an ambitious target would be to have zero surplus nitrogen leaving the farmland. Currently, Farm 2 applies 83.2 kg N fertilizer per hectare each year. In this case, Farm 2 should reduce its nitrogen fertilizer input by 23 kg N / ha * y to stay below the low boundary identified in Figure 12 for aquatic concentrations (0.8 mg TN / L). This would require the farm to reduce fertilizer application by nearly 28%, by applying 60.2 kg N fertilizer per hectare. To stay below the high end boundary of 5 mg TN/L, Farm 2 could apply up to 66.2 kg nitrogen / ha * y, which would mean reducing nitrogen fertilizer inputs by 20.4%. Reducing nitrogen application is particularly relevant in September and October, when lower water levels result in higher nitrogen concentrations in the Ebro river basin. In addition, it is important to avoid applying fertilizer before heavy precipitation events to minimize runoff. Both the high and low targets would keep Farm 2 within safe operating limits for nitrogen on surrounding terrestrial ecosystems. The farm can work towards reducing surplus nitrogen by adjusting fertilizer inputs and timing of fertilizer application, based on recommendations outlined in Phase 3.
We recognize that reducing the fertilizer input by 20% may also reduce tree growth and fruit production, which could result in more land requirements to meet almond demand. This tradeoff needs to be balanced with the land-use boundary and biodiversity impacts, which we discuss more extensively in Phase 3. This nitrogen framework can be replicated for other almond farms within the cooperative to highlight which farms need to make more substantial operational changes to stay within the local and regional nitrogen budget. If some farms are surpassing the boundary and others are operating below the boundary, perhaps some of the nitrogen budget could be traded between farms to meet overall almond demand from Alpro.
Discussion / Key Conclusions
This approach outlines one potential way of calculating a nitrogen boundary and setting a target for both local (terrestrial) and regional (aquatic basin-level) scales. We recognize this framework relies on many assumptions that should be tested and updated with additional research and data. However, we think this approach provides a good first step for translating the planetary boundary for biogeochemical flows into local and regional nitrogen boundaries.
This approach for creating a nitrogen boundary for farm-level activities highlights the difficulty of using context-specific data for local analysis of biogeochemical flows. A real-time monitoring system for fertilizer application, volatilization, nitrogen deposition, and precipitation would improve the accuracy of this analysis.
Some limitations of this model include:
- The concentrations in the last and first month of the year do not show any nitrogen input from farm-to-water as no fertilizer is applied during these months. In reality this might not be true, as leaching of fertilizer might show a different time-based distribution. For instance, nitrogen could accumulate in the soil and leach during winter months;
- Results do not consider atmospheric deposition of nitrogen to rivers or point source emissions such as wastewater treatment plants;
- The model does not account for irrigation as a contributing factor to the leaching-runoff coefficient;
- The model is highly dependant on nitrogen uptake rate assumptions, and should be tested with farm-level data.
Further analysis should test the assumptions built into the model and run different scenarios based on data provided by local stakeholders. In addition, a more complete nutrient boundary should include both nitrogen and phosphorous in the calculation.

Land-use
Land-use change is a driving force that leads to serious reductions in (habitat for) biodiversity in addition to causing negative impacts on water and the biogeochemical cycling of carbon, phosphorus, and nitrogen, as well as declines in multiple ecosystem services (Gourevitch et al., 2016). The aggregated impacts of local level land-use change have consequences for Earth system processes on a global scale. This is why it is so important for companies such as Alpro to consider how their operations influence land-use boundaries on multiple scales: local, regional, and global.
Due to the complexity of interaction between scale and biogeochemical processes and functions, any land-use boundary must also consider the function, quality, and spatial distribution of land. To develop boundaries for land-use, it is important to understand its environmental impacts. There are several major concerns surrounding land-use (Slonecker et al., 2013; Lambin and Geist, 2008) including, but not limited to:
- Natural habitat loss (negatively impacting biodiversity);
- Loss of carbon sinks (contributing to climate change);
- Disruption of nutrient cycles (affecting biogeochemical flows);
- Disruption of water cycles (affecting water quality and availability).
In the course of this pilot, we focused exclusively on the first point – natural habitat loss and degradation from anthropogenic pressures – when considering how a land-use boundary should be set. A complete land-use boundary framework should consider potential tipping points across all four of these areas and ensure that targets are set to protect the most sensitive of these.
Natural habitat loss can result from direct land-use change, where land is functionally reclassified from natural to human activities. This involves the replacement of original natural vegetation with anthropogenic landscapes such as croplands, pastures, and urban areas. Within each of these anthropogenic land-uses there is significant variation in their ability to maintain biodiversity provision, depending on the intensity of the land-use in question, specific practices in place, and whether thresholds of ecosystem functioning are crossed.
Habitat degradation by fragmentation breaks apart large continuous habitats into islands of isolated natural vegetation by, for example, agriculture, transport infrastructure, and built up areas. In comparison to habitat loss as a result of land-use change, there is a significant variation of impact on biodiversity through processes of fragmentation. While fragmentation can leave a proportion of natural intact vegetation (NIV) in a landscape, the structural change can significantly degrade the habitat quality for many species which may rely on larger patches. Thus, certain patterns of fragmentation can effectively lead to habitat loss without actually re-assigning land function. Fragmentation also opens the door to further habitat losses and degradation in the long term (Freitas et al., 2010).
The impacts caused by land fragmentation are highly contextual. Different species, for instance, have different habitat needs; some require long continuous stretches of connected habitat zones, whereas others can easily migrate between patches. Land fragmentation impacts will therefore depend on local habitat types and species populations and on the intensity of the anthropogenic land-use. For example; a heterogeneous mosaic of low-intensity agriculture and forest will have a significantly lower negative impact on biodiversity than fragmentation through urbanisation or intensive agricultural production.
Setting the boundaries
Following the original planetary boundary concept by Rockström (2009), Steffen et al. (2015) developed two control variables for the planetary boundaries in order to track the state of the land system boundary:
- On a global scale: the total area of forested land as percentage of original forest cover should not drop below 75% (75–54% uncertainty zone). These values are derived by a weighted average of the three individual biome boundaries and their uncertainty zones in the bullet below;
- On a biome scale: the total area of forested land as percentage of potential forest should not drop below: 85% (85–60%) for the tropical biomes, 50% (50–30%) for the temperate biomes and 85% (85–60%) for the boreal biomes.
These control variables and zones of uncertainty provide a method to quantitatively assess the current state of the land system change boundary and track the efficiency of restoration interventions on global and biome level. However, because of the contextual nature of land-use impacts, it is essential to further translate these global boundaries to regional, local, and even farm-level guidelines. Such a translation step is necessary for the development of effective land management strategies for governments, municipalities, and individual companies (eg. Alpro). In the following section, we discuss the four relevant geographic scales (global or biome-level, regional, local or landscape, farm level) and their related boundaries in more detail.
Global-scale boundaries
The global perspective should be used to determine and compare the environmental status of different habitats (biomes and ecoregions) throughout the world. Global boundaries can be put in the perspective of (changes in) carbon storage and flows that relate to changes in land-use and land-cover (including biogeochemical flows and water cycles), though as already mentioned, here we focus exclusively on habitat impacts. Sloan et al. (2014) assess land-cover disturbance using the Natural Intact Vegetation index. NIV is the remaining natural vegetation area as a percentage of the originally-vegetated area. The authors observe that there is an inverse relationship between mean NIV patch size and the percentage of hotspot area in NIV. They found that the mean patch size drops precipitously below 1000 [ha] once NIV area falls below 10%. In other words, the individual patches of undisturbed habitat become dramatically smaller as total NIV decreases, which is likely to put certain species types at great risk. This 10% NIV cutoff can be seen as a tipping point or threshold for global biodiversity considering that biodiversity declines exponentially with incremental losses of habitat (Storch et al. 2012 and Rybicki & Hanski 2013 cited in Sloan et al. 2014).
An important question is, for regions where the NIV has fallen below 10%, how much recovery is necessary to return to safe conditions. The 10% threshold would be the equivalent of the start of the “red zone” in terms of the PB framework, but a safe boundary (the start of the “green zone”) must also be defined above the 10% tipping point. Dinerstein et al. (2017) use the following categories to assess the environmental quality of an ecoregion:
- Half Protected: ≥50% of the total ecoregion area is protected;
- Nature Could Reach Half: <50% of the total ecoregion area is protected but the sum of total ecoregion protected and unprotected natural habitat remaining is ≥50%;
- Nature Could Recover: sum of the amount of natural habitat remaining and the amount of the ecoregion that is protected is <50% but >20%;
- Nature Imperiled: sum of the amount of natural habitat remaining and the amount of the ecoregion that is protected is ≤20%.
The 20% limit can be taken to represent a critical boundary. A boundary for a safe operating space would have to be set at some safe ‘distance’ from the critical boundary. For example, the aspirational goal of 50% protected land area emerged in several advocacy and policy papers under the name Nature Needs Half (NNH; e.g., Locke 2013 quoted in Dinerstein et al. 2017). This boundary is well above the 20% threshold before ecoregions are ‘imperiled.’ The aim could be to raise the % of ecoregion protected shown in the table up to 50%.
Combining the approaches proposed by Sloan et al. (2014) and Dinerstein et al. (2017), we can visualize the boundaries and thresholds for different biomes on a global scale, as shown in Figure 13 (underlying data in Appendix A2).
Figure 13 shows that the Mediterranean Forest, Woodland, and Scrub (MFWS) biome, where the studied almond farms are located, has already fallen slightly below the critical tipping point of 10% NIV. The Temperate Broadleaf and Mixed Forest (TBMF) biome, where the soy farms investigated in this study are located, has not yet crossed the 10% tipping point, but has exceeded the critical boundary of 20%, with only 18.6% of NIV remaining. Therefore, both of the biomes under investigation in this study have exceeded safe thresholds as proposed by the literature, though the Mediterranean region where the almond farms are located is in a more critical state. For the remainder of this section, we focus entirely on MFWS biome as a case study.
Regional-scale boundaries
Though global statistics on the remaining NIV in each biome provide important initial framing, we must also look at which specific regions are contributing to losses in habitat. The almond farms evaluated in this study lie in the Mediterranean basin, which is part of the MFWS biome (WWF, 2018a). Large parts of this biome have historically been converted to functions such as agriculture. By 1950, only 30% of original native vegetation cover was remaining. Close to an additional 2.5% of native habitat has been converted since then (Millenium Assessment, 2010). In the entire MFWS biome area, only 2.8% of native vegetation was under protection in 2005 (Millenium Assessment, 2010). This gives an indication of the level of threat for the global biome and of the importance of taking action at a regional scale, e.g., in the Mediterranean as a whole, including the Ebro River Basin. The NIV index for the global MFWS biome is 9.9%. Zooming in on the Mediterranean basin specifically, we see that NIV is even lower, at 4.4% (Sloan et al., 2014). This means that the Mediterranean basin is disproportionately contributing to the loss of NIV in the MFWS biome and is itself even further beyond the globally identified tipping point than other regions representative of this biome. Natural habitats in this region are, therefore, in urgent need of recovery. However, to understand how the individual farms that we are investigating in this study relate to these boundaries, we must also understand what is happening at even smaller geographic scales.
Landscape-scale boundaries
While regional-level boundaries offer a useful overview, it is at the landscape-level that boundaries start to become actionable. Landscapes are the scale at which human and ecological systems and their interactions can be observed, and where complex challenges that transcend sectors can be better understood. As such, landscapes are the appropriate scale for an integrated approach to land management for production, conservation, restoration, and other functions. Land-use “boundaries” at the landscape-scale need to be fundamentally different in nature from the boundaries defined at the regional and global scales. At the landscape-scale, we concern ourselves much more with the type and location of different land uses, including their positioning relative to one another, than just with the overall quantity of land used for different purposes.
From the higher-level scales, we already understand that the MFWS biome is in need of recovery and that, therefore, over the longer-term, certain parts of the Mediterranean basin should be prioritized for rewilding. At the landscape-scale, however, is where we need to investigate which specific parcels of land would deliver the greatest benefit if returned to a natural state relative to others that should potentially be prioritized for agriculture or other activities.5 As described in the section on freshwater balance, the Rio Canaleta sub-basin, where our three almond farms are located, has a very high percentage of natural land cover (73.8%) relative to the rest of the Mediterranean basin. The farms themselves are located close to nature areas, including some protected Natura 2000 zones. In terms of the whole region, this sub-basin is likely to be one of the areas where NIV is at its highest. The specific strategy for land-use management in this sub-basin should be determined with multiple scales of impact in mind: the overall need for increasing natural land cover while also balancing the requirements of agricultural production.
5 This whole discussion intentionally omits the political, social, and economic challenges implicit in questions of rewilding and land-use reassignment. We deal with these points in more explicit detail in Chapter 3.
The position of the almond farms relative to nearby conservation areas provides essential context for our assessment and recommendations. However, landscape management is a collaborative process where common objectives and strategies should be negotiated between different stakeholders. Once these objectives and targets have been set, local level interventions can be defined, together aggregating into a desired landscape trajectory.

Farm-scale boundaries
At the scale of individual farms, the overall percentage of NIV in a particular biome is of lower importance. Rather, boundaries are more related to habitat fragmentation, species, and biodiversity, and what function or ecosystem services the farm itself provides to its surrounding area. Because the local landscape is highly species-, habitat-, and land-use-specific, it must be understood on a case-by-case basis.
Mitigation actions must be planned at the landscape scale but implemented through farm-level interventions, such as through more biodiversity-friendly agricultural practices. Relevant for the three farms in Spain, in a meta-review of agroforestry systems in Europe, Torralba et al. (2016) show that cover crops in Mediterranean tree monocultures increase soil fertility and reduce erosion. The three farms however, do not apply any cover cropping. In the context of optimizing production and biodiversity provision across a landscape, this approach may only be relevant for farms at an appropriate buffer distance to areas where rewilding and conservation efforts are in place. Promoting low-intensity production approaches such as ecological farming methods near or bordering high biodiversity areas can serve to effectively increase their functional extent. Kremen (2015) has shown that organic production at the farm level can aggregate to landscape-level mosaics, which support biodiversity conservation synergies between protected and production-focused areas. Considering the three selected almond farms, it may be the case that the current ecological farming approach may be most appropriate for Farm 1 as it lies closest to a large nature protected area (Figure 6). However, this assumption needs to be tested through a more thorough analysis that includes insights from a collective landscape-level perspective.
The practices for our selected almond farms must aggregate to the larger-scale landscape mosaic and ultimately contribute to regional and global biome restoration (see Figure 14 on the next page for an overview of all scales). Every action an individual farmer makes has an impact on local land use, either in a positive or negative way. When setting a local boundary for land use, companies such as Alpro should look at all their farms collectively, and identify which farms are situated in high-priority restoration areas on the landscape level. Some farms may be located in an area ideal for core habitat, or in an area that would be well suited to connect existing habitat areas by serving as a natural corridor. This classification will determine the type of intervention that needs to be taken on the farm level, while also considering whether the collective almond supply can be maintained over time. This decision will require an equitable allocation approach across the cooperative, since some farmers may need to make more drastic changes compared to others.

In order to transition the status of the local landscape towards the boundary, effective (and area- specific) landscape restoration is required. Landscape restoration is a long-term process that offers an opportunity to collectively address major environmental challenges, such as land degradation, biodiversity loss, water scarcity, lack of sustainable rural livelihoods. It creates opportunities for climate change mitigation and adaptation and can improve overall human well-being (Chazdon and Guariguata, 2017; Gourevitch et al., 2016). So, how can location-specific targets be set and their (restoration) solutions be allocated? One way to approach this is through an allocation framework.
Allocation
Given limited resources, the best returns on investments for landscape restoration combine feasibility with high levels of multiple benefits (Chazdon and Guariguata, 2017). One methodology to incorporate these concerns is through spatial prioritization. “The main objective of spatial prioritization is to select areas for investments and interventions that (1) maximize the long-term success of restoration; (2) ensure representation of biological, geographic, and human diversity; and (3) maximize socio-ecological benefits for local communities and other stakeholders” (Bryan et al, 2004; Chazdon and Guariguata, 2017). A commonly-used application of spatial prioritization is to optimize areas for restoration with a high potential for carbon-stocking and co- benefits for biodiversity at a minimal cost (Bryan et al., 2004; Greve et al. 2013; Renwick et al. 2014; Carwardine et al. 2015). Prioritization tools can highlight important synergies and trade-offs that can help decision makers and practitioners determine how and where to achieve the most desirable and feasible restoration outcomes (Chazdon and Guariguata, 2017).
In this section, we describe the need for creating a landscape restoration framework that takes into account planetary boundaries. While land cover is an important characteristic for the land-use boundary, the function, quality, and spatial distribution of the land should also be considered. The main goal of the framework is to grow corridors, edges, and core areas, and increase the habitat connectivity to effectively contribute locally to reaching the global restoration target (critical boundary), while at the same time optimizing regulating ecosystem services such as carbon, water, and nitrogen cycling, and farmland productivity. Summarizing, the allocation and farm-level interventions are derived from the local context, but also interpreted within the ecological landscape, and global land-use boundary.
To properly set local restoration goals while taking the global land-use boundary into account, an understanding of the local context within the overarching landscape is required. In order to understand this local context, we recommend starting with a baseline analysis of the Mediterranean Basin’s NIV, deriving the composition and distribution between the original MFWS vegetation types. Subsequently, the appropriate scale level for analysis has to be determined. The scale level is used to set the scope for the collection of the spatial data. Scale is also important to put the locally-specific restoration goals in the perspective of the overarching landscape and biome. After determining the scale, project-specific (GIS) datasets are collected. These datasets should be linked to criteria (eg. Degradation, Disturbance, Diversity) and indicators (eg. Patch area, distance to towns, edge density, land cover heterogeneity, species richness) that can be used to quantitatively prioritize landscape restoration (Orsi et al., 2011 – see Table A2.2 in Appendix A). The criteria and indicators should therefore be operational, suitable for spatial analysis and mapping, and applicable to a broad range of contexts (Orsi et al., 2011).
Because landscape restoration consists of spatially- and temporally-dependent processes, modeling scenarios of restoration should also incorporate these dynamics (McBride et al. 2010; Rappaport et al. 2015). Therefore, we assess the landscape across three axes (context, space, and time). To do so, we apply an object-based remote sensing approach (Blaschke, 2010; Hernando, 2017). After understanding the local context and landscape in time and space, we can build a model to classify the research area into priority categories for restoration based on targets set for an optimum landscape according to trade-offs of production versus conservation.
A spatially-explicit model is required for informing the type of intervention for each individual gridcell based on the local context. The proposed model combines a decision tree approach and a spatial multi-criteria analysis. This approach superimposes GIS-datasets to reveal areas where high priorities (e.g. high degradation, fragmentation, proximity to Natura 2000 areas) and feasibility for restoration (e.g. distance to infrastructure, capital, political support) overlap using a fuzzy-logic, object-based approach (Blaschke, 2010; Chazdon and Guariguata, 2017; Hernando, 2017). The variables for determining the priority and feasibility are either directly or indirectly (calculated proxy) derived from the GIS-datasets. For every priority area the most feasible type of landscape restoration is determined. Types of landscape restoration include among others; corridor creation, edge expansion, and core expansion.
Next to landscape restoration, we can apply algorithms to identify the optimal farm-level interventions for a particular context based on the initial landscape assessment. Variables considered in the analysis include: soil characteristics, production, local environmental impact (FAO, 1994), and proximity of farms to high priority areas. In phase three of this document the best practices and farm-level strategies and interventions are discussed in more detail.
While a model can prioritize areas for restoration based on urgency and feasibility, stakeholders make the decision on how many and which areas will be restored. Since the initial state of the NIV within the considered area is known, the decision to restore a given number of areas can directly be translated to the overarching biome and its effects on the measured land-use boundary. Once this approach is implemented, it is essential to establish a monitoring strategy to evaluate the progress of particular land-use interventions at local and higher levels, aggregating to a metric at the company-level (Alpro). With both company-wide and regionally-specific land-use metrics, Alpro can make recommendations for further interventions or revision of goals (see Figure 15).
Landscape restoration in a complex landscape involving many stakeholders is a difficult process. Using a sparing and sharing approach for optimizing landscape and farm-level interventions could offer a solution.
Sparing & Sharing Approach
Landscape structure has been shown to be more important than farming practices for certain species. In productive landscapes, heterogeneous land-use mosaics have been shown to be optimal for biodiversity provision (Kremen 2015). Metrics related to land-use intensity and heterogeneity such as the proportion of arable fields, the typical field size, and the number of habitats can also be linked to supporting enhanced biodiversity (Tuck et al. 2013).
Barral et al. (2015) have shown in a meta-analysis of landscape restoration that interventions, whether land-sparing or land-sharing, have increased biodiversity and regulating ecosystem services by an average of 73%. Furthermore, increases in biodiversity positively correlated with increases in regulating ecosystem services and vice versa. Restoration strategies were either land-sparing or land-sharing. Land-sparing studies generally worked on the level of 5 [ha] to 1000 [ha], while land-sharing studies were typically less than 5 [ha]. Kremen (2015) suggests that an either/or dichotomy of sharing or sparing will fail to meet either future production or restoration needs. Furthermore, species in farmland cannot be entirely sacrificed in order to preserve biodiversity elsewhere. In addition, some species, particularly in Europe, where farming has been an integral part of the landscape for thousands of years, thrive in extensively managed farmland and are clearly threatened by agricultural intensification (Chamberlain et al. 2000).
Coming back to the Canaleta sub-basin where the almond farms are located, the implementation of a mixed sharing and sparing approach by Alpro and partners could include farm-level interventions to increase and enhance biodiversity production, while also investing in biodiversity conservation and restoration on degraded or unproductive lands identified by the spatial prioritisation model. This can be understood as a landscape level offsetting mechanism whereby additional habitat-rich land is brought under management or co-management to increase the proportion of biodiversity provision by Alpro in the production of almonds. In terms of practical implementation, engagement with local stakeholders such as nature conservation agencies, landowners, cooperatives, and municipalities could result in synergistic land management objectives being discovered, and the strengthening of local relationships for Alpro and its farmers in the landscapes where they work.
The ideal system in biodiversity provision may therefore be a mosaic of large protected areas surrounded by a matrices of conservation farming production systems which on a landscape-level work synergistically. Metrics and targets are therefore highly context-specific and should reflect the characteristics of the landscape in question, including the production system and its position and connectivity in the surrounding land system.
Setting targets
To relate the boundaries and targets perspective to local restoration methodologies it is important to integrate the location characteristics and activities taking place. Especially in fragmented landscapes, landscape structure is known to affect species persistence and to influence restoration outcomes (Tambosi and Metzger, 2013). Therefore, restoration planning should incorporate landscape characteristics, local biophysical conditions, and socio-economic conditions in decision-making processes in order to optimize efforts, cost-efficiency, and maximize biodiversity conservation (Tambosi and Metzger, 2013).
Where assessments show that a land-use boundary has not been exceeded, measures are necessary to protect from future degradation or land-use change. Where the set boundaries have been exceeded, restoration measures must be implemented to bring the land system within a safe operating space. However, prioritizing areas for landscape restoration is complex, involving multiple social and environmental criteria that vary across space and time (Bryan et al. 2004). According to Bryan et al. (2004) systematic approaches to prioritization are neither top-down nor bottom-up; rather, they are built on optimization principles that can reflect a wide range of social, political, economic, and ecological needs. This can be approached by using tools that enable a transparent and systematic approach to decision-making (Chazdon and Guariguata, 2017). These tools require spatial data, which can provide indicators for feasibility and restoration benefits (Chazdon and Guariguata, 2017), and provide accurate mapping of various parameters that affect land-use (Bryan et al., 2004).
Discussion / Key Conclusions
According to Hewitt et al. (2014) land-use modelling work that aims to be policy-relevant should seek to integrate traditional non-participatory approaches with discursive soft-science methodologies. The key to model calibration resides in finding an adequate balance between the statistical goodness of fit of available data and acceptance among relevant stakeholder communities (Hewitt et al. 2014). Multi-sectoral planning and stakeholder engagement are essential for the implementation of successful landscape restoration actions and for mobilization of adequate public and financial support (Chazdon and Guariguata, 2017).
Even the best algorithms and decision support tools might produce inaccurate results due to spatial resolution limitations of available data. Coarse scale prioritization may fail to indicate optimal restoration outcomes within management units, where conditions that vary at small (local) spatial scales ultimately influence restoration outcomes and performance (Chazdon and Guariguata, 2017).
Decision support tools rely heavily on satellite imagery or aerial photographs and the spatial land cover data they provide. However, qualitative and quantitative information about the flora and fauna associated with these land covers is not provided by these remote sensing data sources (Dirzo et al. 2014). As a result, critically important information about landscape configurations, structure, and composition of plant and animal species, the multifunctionality of existing landscapes, and how these functions could be affected by restoration interventions is often lacking (Turner et al. 2016; Chazdon and Guariguata, 2017). Any decision support tool for the purpose of land use optimization would therefore ideally be complemented with data from on-the-ground observations.

Biodiversity
Biodiversity impact
Activities involving natural resource consumption usually have a strong direct impact on biodiversity through land use and an indirect impact through their contribution to climate change, with the agriculture sector strongly contributing to biodiversity loss (CBD, 2014, Kok et al., 2018). Since agricultural products and commodities are important ingredients in Alpro’s almond and soy drinks, this pilot includes an impact assessment on biodiversity.
This study assesses the biodiversity footprint for 1 liter of almond drink and 1 liter of soy drink without packaging. The almond drink footprint is based on the production chain for almond paste produced by the cooperative in Spain. The soy drink footprint is based on soy production by the cooperative in France.
The biodiversity footprint methodology is based on the GLOBIO framework of the Netherlands Environmental Assessment Agency (PBL, see Alkemade et al., 2009) and was developed and tested in previous case studies (Arets et al., 2017; van Rooij and Arets, 2016, 2017; van Rooij et al., 2016).
In the GLOBIO approach biodiversity is derived from the impact of a number of pressure factors on biodiversity, including land-use intensity, climate change, nitrogen deposition, and fragmentation. In most cases, land-use change and climate change are the most important impact factors (e.g. Knapp et al. 2017; Sala et al. 2000; ten Brink et al. 2010) with land-use change causing direct negative effects due to loss of habitat and climate change having a more gradual impact on the occurrence of species. These impacts can be directly linked to activities of companies and production chains, which is why our biodiversity footprint approach focuses on these two pressures. Additionally, we developed an approach to analyze the effect of point water withdrawal on biodiversity. We assessed the effects of nitrogen emissions to water using the GLOBIO-aquatic approach (see Janse et al., 2015).
For each pressure factor, except water consumption, we used dose-response relationships based on meta-analyses of scientific studies to determine biodiversity impacts (see Appendix C for details; Alkemade et al., 2009 for land-use intensity; Arets et al., 2014 for climate change). In general, the greater the pressure, the greater the biodiversity loss. For point water extraction, we used an approach that assesses consequences of lowering ground water table on the occurrence of original plant species, which yields a similar biodiversity indicator as the other pressures.
Biodiversity loss is expressed with the relative biodiversity indicator “Mean Species Abundance of original species” (MSA), representing the natural or original biodiversity of an area in a value that ranges from 0 to 1. The MSA has a low value in areas where a specific pressure factor is high. In the biodiversity footprint method, the change in MSA indicator value is multiplied by the size of land impacted by the pressure factor. This process is outlined in Table 4 below.

The equation for determining the biodiversity footprint is:
Footprint = ∑(ha area in usei * [1-MSA_pressure factori ])
in which i= land use, climate change, water use, and nitrogen emissions in water
This equation is used to calculate a biodiversity footprint MSA.ha for a baseline and for different scenarios, enabling comparisons to be made. In addition to land use and climate change, this footprint study includes the impact of water use and of nitrogen emissions in water.
Land use
Because of the direct relationship between land use and biodiversity, this pressure factor plays a key role in determining a company’s or a product’s impact on biodiversity. Land use can play a role in various parts of the production chain. This concerns, for example, land use for production of raw materials by suppliers and by the company itself, land use directly related to the company’s own production processes (such as factories and storage facilities), and possibly land use associated with waste processing. Since the impact varies per land-use type, the area and type of land use management in each part of the production chain has to be determined separately.
For a number of land use types, the GLOBIO3 framework MSA values are based on a dose-response relationship between land use type and biodiversity. For company infrastructural site locations, the MSA land use value is set at 0.05. This value means that for this type of land use only 5% of the original biodiversity remains and thus 95% has disappeared. The MSA values of the generic GLOBIO3 land use classes are averaged. In reality, MSA values vary depending on land use intensity (Alkemade et al., 2009). There may be large variations particularly for secondary forests and plantations, due to differences in management such as clear felling versus selective felling, rotation length, and species composition. MSA values can be determined or adjusted to differences in local conditions by using local expertise on the natural state of a land use type in a specific region.

Climate
Greenhouse gas emissions contribute to climate change, which in turn has an impact on biodiversity. The climate-related dose response relationship used in GLOBIO3 shows the decrease in biodiversity (MSA) versus the increase in global mean temperature (Arets et al., 2014). Thus, we start by determining the contribution of greenhouse gas emissions to the mean global temperature. This requires insight into the company’s greenhouse gas emissions and products associated with the biodiversity footprint analysis. This includes emissions from transportation, energy use, heating, and processing, as well as emissions from agriculture and land use.
Because climate change has not only a local but also worldwide impact on biodiversity, the climate impact on MSA occurs worldwide in natural and semi-natural ecosystems. Thus, the MSA impact per ha is multiplied by the total global land area for ecosystems in natural and semi-natural state. This delivers emissions per kg in CO2 equivalent, an MSA impact of 3.29 ·10-5 MSA.ha (see also, van Rooij et al. 2016).
Water withdrawal
In addition to the immediate impact on a location that is already discounted in the MSA impact for land use, point water withdrawal impacts nearby nature areas. The impact is largely local and depends on site conditions, such as groundwater table level, soil type, and vegetation response to potential changes in water availability. The effect of water extraction on water availability also depends on the depth, length of time, and location of the water withdrawal in relation to vulnerable nature areas. The impact is determined from the reduction of groundwater levels, which is an indicator for drought effects.
The first step in calculating the MSA for water withdrawals is to determine the potential groundwater level without additional water withdrawal, and 2) for the present situation with water withdrawals by the company. To determine the potential groundwater level without water withdrawal, we used soil maps, hydrological models, and information from monitoring wells and relief maps.
Nitrogen and phosphorus emissions to water
In addition to land use, greenhouse gas emissions, and water extraction, nitrogen emissions to water are key pressure factors on biodiversity. For canals, rivers and lakes, the dose-response relationship between nitrogen or phosphorus concentration and biodiversity is available from the GLOBIO aquatic methodology (Janse et al. 2015). This relationship is used to calculate the impact of nutrients on aquatic biodiversity. The aquatic pressure factor is calculated separately and is not added to other terrestrial pressure factors because of its deviating characteristic, for instance, variation in flow and depth. The method is further elaborated in Appendix C.
Setting the boundary
Setting boundaries and targets for loss of biodiversity is highly controversial. For this pilot we set the boundary for loss of biodiversity at zero loss of natural biodiversity. Because that is not possible with any agricultural production, the aim here is to provide insight in ways to minimize biodiversity loss.
Setting targets
Since any agricultural production implies loss of original biodiversity, we focus on identifying the main sources of impact on biodiversity within the almond and soy drink production chains and assessing possible ways for decreasing this impact. Using these methods, the biodiversity footprint of various situations can be compared for the same functional unit.
The biodiversity footprint of the current situation without interventions, referred to as the baseline, can be compared with the footprint of an alternative or future situation in which biodiversity-friendly measures are implemented. Alternative production methods or the use of different raw materials can also be compared, as well as different management practices and production intensities.In this way, we can compare trade-offs between yields, production intensity, and biodiversity impact. The almond drink and soy drink are addressed as two separate cases. Each case has a different methodology due to differences in data availability.
Biodiversity impact is assessed for one liter of soy and almond drink without packaging as a functional unit, using 2017 as the time frame. The production chains include the agricultural production in the field (almond orchards or soy fields), GHG emissions from transport, processing of the raw materials (hulled almonds or soybeans) to intermediary products like almond and soy paste, and finally the preparation of the drinks.

Almonds
The assessment for almond farming is largely based on information provided in the carbon footprint report by the Spanish cooperative for the production stages up to the production of 1 kg of almond paste. The agricultural practices and management of the farms included in this analysis were assumed to be representative for all the cooperative’s farms. We identified two management types (conventional and organic farming) and two types of irrigation: dry (no irrigation) and irrigated. Based on this, we created three different combinations of management practices and intensities:
- Dry organic farms (2 farms, total 14 ha, 9 tonne almond),
- Dry conventional farms (5 farms, total 14.7 ha, 18.205 tonne almond), and
- Irrigated conventional farms (5 farms, total 100.9 ha, 239.7 tonne almond)
The three types differ in their productivity (in tonnes almond per ha) and impact on biodiversity. The biodiversity footprint of 1 ha production (1-MSA) on the different farms is elaborated in Appendix C. However, while assessing the footprint per unit of product, the overall impact may be lower with higher productivity per unit of area. Insights in such trade-offs will help to identify options to reduce the biodiversity footprint.
To estimate the trade-offs (increasing productivity versus decreasing local biodiversity) and thus to estimate the impact of the different management types on the footprint, we selected three scenarios in line with the farm management types:
- Management scenario based on data from the 12 farms in the cooperative’s report.
- 100% irrigated conventional: Represents the scenario if all almonds Alpro uses would be produced on the irrigated conventional farms.
- 100% organic: Represents the scenario if all almonds Alpro uses would be produced on organic farms.
In each scenario analysis, productivity and MSA impact were weighted using total almond production from each farm.
Using this model, we can also assess different scenarios for reducing GHG emissions within Alpro operations.Since the relation between GHG emissions and biodiversity impact is assumed to be linear, the reduction in impact is directly proportional to the emission reductions.
Data on point water withdrawal for irrigation were very limited and insufficient to assess the effects of water consumption on nearby natural areas. Data on amounts of water withdrawals used for irrigation were available, but no information on depth of the withdrawal. We have been exploring alternative approaches, including a meta-analysis on impact of water withdrawals (van Zelm et al. 2011), indicating a loss of 10% of species per 10 cm decrease in ground water level. Yet, still these require that information on impact of water withdrawals on ground water level be available. In previous case studies in Belgium and the Netherlands (Arets et al., 2017) the contribution of water withdrawals was estimated for two production plants that extracted large amounts of water from deep aquifers. The resulting effect on ground water level was very small and eventual contribution to the biodiversity impact was less than 0.1%, mostly close to the withdrawal source, while there was no impact further away than 500m.
Because there is a rainfall deficit in these relative dry areas, causing irregular N and P leaching rates, determining N-emissions from almond farms to water was more complex than in regular biodiversity footprint assessments. For this reason, we estimated nutrient runoff based on N and P surplus from fertilization. We calculated the impact on aquatic biodiversity based on farm outputs in a selected sub-basin and nutrient concentrations in the water. The sub-basin selected for the aquatic footprint determination is shown in Figure 15 on the next page. The aquatic footprint calculation is limited to the part of the Ebro river that receives its water from this sub-basin. The actual aquatic footprint will be a bit bigger as emission from the almond farms will also have an impact on all smaller level streams that flow into this part of the Ebro river. As there was no N emission information available for these streams, these were left out of the analysis.
Due to the scope of this analysis, we excluded the impact calculation of P in this study, and we also did not calculate potential N emissions from Alpro’s processing plants. Detailed information on the calculations is provided in Appendix C.

The water volume of the river segment was estimated based on the water flow rate between gauging stations Ascó (906) and Xerta (910). Since the volume changes throughout the year due to a large fluctuation in rainfall, the volume was estimated per month. The Spanish CHEbro water authority also provides information on the concentration of nitrogen per day (See Appendix C). However, this amount includes N emission from all emitters in the sub-basin including the almond farms.
The area of almond farms in the sub-basin was estimated based on a GIS analysis of the ESA CCI land cover map of 2015 in combination with an interpretation of Google Earth imagery. As the actual distribution of farm types (organic, conventional, etc) within the sub-basin is not known, the N emission of three possible situations was analysed and compared to the existing total N emission in this part of the Ebro river. The first situation assumes that all farms in the sub-basin are managed organically with a similar N surplus per area as calculated for the two organic farms, the second as conventional farms, and the third as irrigated conventional farms. We assumed that all the N surplus from the almond farms plus N deposition from the air will finally end up as emission in the Ebro river. Finally the GLOBIO aquatic dose-response relation for the impact of N concentration in river water on aquatic biodiversity is applied.
As the exact footprint of the almond farms in the river segment is difficult to measure we calculated the difference in the aquatic footprint of this river segment for the theoretical situation that the almond farms in the sub-basin would change to another farm management. Four possible scenarios were analyzed:
- Scenario 1: No change of farm type. N concentration is based on real measurements in 2017;
- Scenario 2: Assumes that all almond farms in the sub-basin are conventional almond farms that convert to organic farm management;
- Scenario 3: Assumes that all almond farms in the sub-basin are irrigated conventional almond farms that convert to organic farm management;
- Scenario 4: Assumes that all almond farms in the sub-basin are organic almond farms that convert to irrigated conventional farm management.
Soy
For Alpro’s soy drink, we assessed the impacts of land-use and climate change. Due to data and time restrictions the effect of water withdrawal and the aquatic footprint are not included in this analysis The methodology for the assessment of land use impact for the production of soy drink is similar to that of almond drink. All calculations are based on information provided by the soy supplier (cooperative). The farms are located in four different regions: Sundgau, Hardt, Plaine, and Ried. Conversion data is provided in Chapter 2 (Figure 5) and additional information on economic allocation is extracted from 2015 surveys from Ecofys (Kerkhof and Terlouw, 2015).
We assumed that all farms have the same management practices. We explored the effect of productivity by applying five scenarios:
- Actual 2017 situation (2017 cooperative mix); all farms used for calculation of productivity and impact, weighted for their total production for Alpro;
- Productivity of all farms is like the farms in Hardt;
- Productivity of all farms is like the farms in Plaine;
- Productivity of all farms is like the farms in Ried;
- Productivity of all farms is like the farms in Sundgau.
The methodology for assessing the impact of climate change for soy is similar to the approach for almonds. The emission and conversion data was provided in Chapter 2 (Figure 5). Greenhouse gas emissions were converted to emissions per liter of drink. To take into consideration differences in productivity, we levelized the farm-level emissions per region for relative productivity compared to the overall average for all farms in the four regions.
Allocation
In this case for biodiversity there is no allocation over sectors, since the footprint is assessed for the activities related to the production of almond or soy drinks by Alpro. Processing of almond hulls and soybeans to their finally used form in the Alpro drinks results in numerous residue products that still can be used in other applications and therefore represent a certain economic value. To attribute the biodiversity impact of agricultural production and the intermediary processing steps we used economic allocation of the contribution to biodiversity impact, which is often used in life cycle analysis (see Appendix C for more details).
To see main processes contributing to impact on biodiversity, the results are presented per impact category (land-use, climate change, water extraction, and N emissions to water) for each processing step.
Almond
The results for almond show that land-use in the 2017 mix of farms contributed 80% to the biodiversity footprint of a liter of almond drink, while climate change effects contributed 20% (Figure 16). The effect of point water withdrawn is not included. A worst case calculation for the biodiversity impact of water withdrawals (Appendix C) increases the biodiversity footprint for 2017 by 0.4% and the footprint in the case of 100% irrigated by 0.7%.
On a per unit of farm area, the organic farms have a lower biodiversity impact in the landscape than dry and irrigated conventional farms (MSA land use 0.25 vs 0.2 vs 0.1, Appendix C). However, productivity of these organic farms (as provided in the cooperative reports) is about half of the productivity in conventional dry farms, and 27% of the productivity of the irrigated conventional farms (Appendix C), resulting in a significant trade off on the area needed for production: a much larger area is needed for the production of 1 liter of almond drink. This translates in a total terrestrial biodiversity footprint that is more than two times bigger for the all organic farm scenario than the footprint of the actual almond farm situation in 2017. Additional to the productivity effect, there is also another aspect that influences the relative large footprint for the organic farms per liter of almond drink. Just like the other two farm types, organic farms also clear the vegetation below the trees, which may increase the biodiversity footprint.
The land-use biodiversity footprint is mainly the result of the impact of almond cultivation (Figure 17 on the next page). The facilities used for almond processing and drink production have a very large biodiversity impact at their location, but are relatively small per liter of almond drink produced. Beet sugar production, a component of almond drink, has a smaller biodiversity land-use based footprint per liter of almond drink. This is mainly a result of the relatively small amount of sugar per liter of drink and the high productivity of sugar (Appendix C).
Although the GHG related footprint of the organic farm scenario is lower (9.4%) than that of the actual 2017 situation, this only has a limited effect on the total footprint for the organic farms as the share of the GHG footprint is much lower than that of land use (Figure 18).

The monthly water volume of the river segment varies between 300 m3 in December and more than 1000 million m3 in March and corresponds with the rainfall pattern in this area. The highest concentration of nitrogen can be found during the period from January through March when high rainfall washes out surplus N from the agricultural farm in the sub-basin. For the almond farms a similar monthly variation pattern is assumed as found by the measurements in the Ebro river to estimate the monthly N emission of these farms for which only the yearly N surplus is known. As mentioned in the nitrogen boundary section, further analysis should examine nitrogen concentrations during low flow months, when lower dilution could account for higher nitrogen concentrations in aquatic systems (Torrecilla et al., 2005).
The actual 2017 N-emission in the river includes the N emission of the almond farms. Based on these emission figures the MSA_aquatic levels in the Ebro river segment vary between 0.43 in January and 0.65 in August. The aquatic biodiversity levels are higher in the summer as there is less rain in this season to transport N surplus to the river.


As nitrogen levels between organic and conventional farms do not differ significantly, it is obvious that the total aquatic footprint of all emitters in the river does not change much if the conventional farms would change their management into organic farming (Figure 19). However, the overall aquatic footprint would reduce 13% in case irrigated almond farms would change their management to organic farming, and increase by 11% if organic farms would change their management to that of irrigated conventional farms.
Soy
In the case of soy, land-use intensity is responsible for 80% of the biodiversity footprint (Figure 20) compared to 20% as a result of a contribution to climate change. The biodiversity level for cropland in terms of MSA was assumed to be the same for all farms and in all regions. However, farm productivity per hectare of soy field differed among the regions, with the Hardt region being most productive and the Sundgau region the least productive. This directly translates to the differences observed in Figure 20.
More information explaining the differences in productivity (e.g. on management practices, soil, fertilizer application, etc) would allow for further analyses of differences and provide guidance for possible reduction in the biodiversity footprint.

Discussion / Key Conclusions
Biodiversity footprint almond drink
Land use has the largest contribution to the biodiversity footprint of almond drink (80%). In the landscape the organic farms have a smaller biodiversity impact (loss of about 70% of the original species), while the more intense irrigated farms have the highest impact (loss of about 90% of the original species). However, when translating this to the impact per unit of almond drink produced, the observed trade-off with almond productivity becomes important. This trade-off is because the farms with the highest productivity, such as the irrigated conventional farms, have the lowest biodiversity footprint, and organic almond farms with their very low productivity have the largest footprint per unit of drink. This trade-off is observed regularly (see for instance previous case studies in Arets et al., 2017; Balmford et al., 2018; and Poore and Nemecek, 2018).
Solutions to decrease the biodiversity footprint therefore lay in finding ways to increase the productivity without having additional effects on biodiversity on the organic farms and taking measures to reduce the impact of the more intensively producing farms. To achieve this will undoubtedly not be easy. Finding solutions would need a more extensive agronomic analysis as to what factors are limiting growth and production of the almond trees and more detailed insights in the biodiversity impact of specific agronomic activities in the orchards. However, important clues on how this can be achieved appear to be through undergrowth management and nitrogen fertilization.
Regarding the undergrowth, at this point all vegetation below the trees is removed. Although this is a measure to decrease competition for water and nutrients with the almond trees, this practice also strongly contributes to biodiversity loss. The trade-off between productivity gains and biodiversity impact of this practice would need to be assessed in more detail.
The nitrogen balance (see Appendix C) indicates that most of the farms currently apply relatively low amounts of N fertilizer (both non-organic and organic), hinting at a nitrogen deficit which possibly keeps the production of almonds low on their land. In case the organic almond farms would implement higher levels of (organic) nitrogen without creating a nitrogen surplus, almond productivity will increase, while the local terrestrial biodiversity likely would not be affected significantly. This could reduce the terrestrial biodiversity footprint notably. A higher application of N fertilizer would, however, also slightly increase the aquatic footprint. Alpro should set priorities to deal with this trade off between the terrestrial and aquatic footprint.
The contribution emissions of greenhouse gases in the different parts of the production chain to climate change contribute 20% of the biodiversity footprint in the 2017 mix. Emissions associated with the organic production were much lower. Since there is a linear relation between emissions, contribution to climate change, and biodiversity impact, the reduction of greenhouse gas emissions will directly also reduce biodiversity impact.
In this report we included the greenhouse gas emissions from agricultural production processing and transportation of almonds at suppliers and drink production at Alpro’s plants. The study ECOFYS life cycle assessment (Kerkhof and Terlouw, 2015), shows that additionally packaging, distribution and storage, retail, and consumer use, more than double these emissions, and thus the GHG related part of the biodiversity footprint.
The biodiversity impact of ground water withdrawal extraction on neighboring natural areas seems to be negligible, based on the 2017 number on water withdrawn. The analysis with maximum impact (“worst case”) assumptions showed little impact. Partly that was because withdrawal on the farm appeared be from the centre of the orchard. As a consequence, part of the excess water applied during irrigation would refill ground water again. Results of the assessment of water boundaries (Phase 2 – Freshwater boundary), however, indicate that further irrigation should be limited.
Biodiversity footprint soy drink
Also for soy drink, farmland contributes the largest part to the biodiversity footprint. As there were no data available on different management levels between the selected soy farms, but only on production and application of fertilizer and pesticides per region, it is difficult to relate differences in footprint to different management practices at farm level. However, also for this type of farm, a higher productivity is expected to lead to a lower biodiversity footprint.
For the footprint analysis of soy farms, further analysis should explore why the productivity rates differ between regions, perhaps due to growing conditions. Further study should investigate why the management practices of the Hardt farms lead to a higher productivity. In case the productivity is mainly caused by different management factors, it could be interesting for Alpro to introduce the Hardt practices to the other regions in order to successfully reduce the biodiversity footprint for the production of soy drink by the cooperative’s farms in France.
General
A higher productivity leads in general to a lower footprint. However, this will be at the cost of local biodiversity. The footprint results reveal the trade-off caused by extensive land management practices. Lowering productivity levels while almond demand remains the same will likely lead to the conversion of additional land, and that land does not necessarily have to be from the same area or country. Since land-use change is one of the major drivers of biodiversity loss in the world, using more land for agricultural and industrial purposes will be a serious threat to remaining natural lands and should thus be avoided.
However, there should be a balance between acceptable biodiversity levels at the local level and productivity rates. It is a political decision to remain or increase biodiversity levels in certain areas while increasing the productivity in other areas that have a lower priority for nature conservation.
This footprint method does not differentiate between additional biodiversity loss and maintaining low biodiversity levels. Avoiding biodiversity loss in biodiversity priority areas might well justify expansion of land use for crop production elsewhere.

Phase 3: Strategies for impact mitigation
Each of the research trajectories described in the previous chapter explore how one of the four impact areas under investigation could be downscaled and evaluated in the context of specific farms in Alpro’s almond and soy value chains. With each research team dedicated to a separate topic and testing a diverse set of methodologies, it is only natural for this work to result in a broad set of action points and conclusions. In this chapter, we collect the insights generated in the first two phases of our research into a combined set of recommendations for what Alpro can do to bring actors in its value chain within identified ecological limits.
The set of farms evaluated in this study is a very small proportion of Alpro’s suppliers, as this project was set up as a pilot for testing methodologies. It is therefore too early to say anything definitive about overall impact across its soy and almond value chains. Moreover, the specific farms we selected are possibly not fully representative of all the farms in the geographies we were looking at. Therefore, rather than focusing on improvement trajectories for these specific farms, we use them as examples, and focus instead on some of the broader principles for how Alpro can approach impact mitigation in its supply chain.
Summary of Phase 2 results
Table 5 shows a high-level overview of the combined Phase 2 findings of all three research teams. Though, as noted in the Table description, these results merely represent the outcomes of our models (and require further testing and ground-truthing to evaluate how well they match with what is happening in reality), we can draw some preliminary conclusions about the collective performance of the farms we evaluated:
- All farms appear to be crossing the global and regional land-use boundaries.
- All farms appear to be crossing the biodiversity boundary.
- Almond Farm 2 appears to be crossing both of the defined aquatic and terrestrial nitrogen boundaries.
- None of the farms seem to be crossing the two freshwater balance boundaries (Environmental Flow and Green Water Balance).
- Though the landscape- and farm-level land-use boundaries were not formally defined or evaluated, available contextual information about farm practices (e.g., clearing of land between the rows of almond trees) and the farms’ high proximity to nature areas, suggest that one or more of these farms is also likely crossing landscape- and farm-level land use boundaries.
Mitigation approaches
In an ideal scenario, Alpro would have the necessary tools to quickly and accurately assess all of the farms, production facilities, and logistics operators in its value chain on whether or not they are crossing any ecological boundaries. After performing such a broad screening, Alpro could identify impact “hotspots”: the geographical regions, boundary areas, or suppliers that are associated with the most severe impacts. The identification of hotspots is an important step in prioritizing efforts for impact mitigation to ensure the most effective and rapid results. From our contextual research in Phase 2, we have shown that for a majority of key impact areas, agricultural activities are the source of the most significant impacts, which is the reason that we have focused on farms in this study. Once high-priority farms have been identified, where it is clear that one or more of the “safe” boundaries has been transgressed, there are three main topic areas that need to be considered before being able to craft a suitable package of mitigation measures:
1. Mitigation effectiveness: Can the transgression of the crossed boundaries be mitigated by applying efficiency improvements or best practices? Or are the transgressions severe enough that more radical measures (such as removal of the target activities) need to be applied? If the freshwater balance boundary is so severely transgressed in a particular sub-basin that the boundary would still be crossed even if all actors were operating at maximum efficiency, this may call for a more radical solution outside of the realm of influence of the individual actors. There are, for example, rice producers in the Ebro basin, who are likely consuming a highly disproportionate amount of the available water supply due to the highly water-intensive nature of this crop. An important question to consider in this case is whether rice should be grown in this region at all. Rather than having all farmers implement extreme water conservation measures, the solution here may involve changing policy to prevent the farming of crops with a water-demand profile that is poorly-suited to the region.
2. Trade-offs: Are there trade-offs between mitigation measures for the boundaries that have been crossed? Which boundaries are most severely crossed relative to one another? It is essential that the environmental boundaries that have been crossed are not considered in isolation from one another (as we have done in the previous chapter of this report). Rather, these impacts should be looked at simultaneously in order to develop optimized solutions that address all problems synergistically. For example, in the case of a farm that has crossed all the boundaries that we have assessed in this report, there may be a clear conflict between land-use and freshwater; or land-use and nitrogen application. Agricultural yields increase – at least temporarily – when a higher level of inputs such as water or fertilizer is applied. Therefore, farms may perform better on land-use metrics when they are crossing water or nitrogen boundaries. Ultimately, there needs to be a prioritization between the different impacts based on the degree to which the individual boundaries are transgressed. The optimal package of interventions should therefore involve a triangulation between multiple indicators, using a multivariate optimization process.
3. Degree of influence: Which stakeholders need to participate to successfully implement the recommended interventions? Can the identified impacts be brought within the boundaries through the actions of single actors, like the farmers themselves? Or do they require coordination between multiple stakeholders at higher spatial scales? In the case of the nitrogen deposition boundary we examined (the most localized of the boundaries evaluated in this pilot), farmers can assess and mitigate the impacts of this issue entirely independently. However, in the case of boundaries where the actions of individuals collectively add up to larger problems (such as the aquatic nitrogen boundary, freshwater balance, or land fragmentation) the need for allocation of responsibility between actors becomes apparent. By the very nature of these issues, a higher governing body should ideally preside over the allocation process, and, in many cases, the successful implementation of its outcomes will require a change in policy or incentive systems. For example, if Alpro finds that some of its suppliers’ farms are in areas that should ideally be slated for rewilding, this is something that should ideally be dealt with on the level of regional planning. Alpro can begin a dialogue with on this topic with the farming cooperative, the farmers, and the regional government. However, decisions must ultimately be made by the local stakeholders.
The different considerations explored through these questions are visualized schematically in Figure 21 on the previous page. These questions must be answered within the context of each farm before an adequate mitigation strategy can be developed, following this rough prioritization of activities:
- Boundary transgressions should be identified, ranked in terms of severity or priority, and any trade-offs between boundaries should be flagged.
- For those impacts that can be addressed within the isolated operations of the farm without creating additional pressures on other boundaries, a mitigation strategy should be developed and implemented.
- For mitigation efforts that create pressures on other boundaries, impacts that cannot be mitigated, or problems that require larger-scale collaboration, a broader process needs to be facilitated to identify appropriate solutions. Alpro can play an important role in initiating such a process, or providing support to its partner farming cooperatives in initiating or managing such a process.
Exploring interventions
The overarching strategies for impact mitigation described in the previous section must ultimately lead towards concrete actions at the level of the landscape or farm. There are thousands of existing resources that help guide farmers towards more sustainable practices; as such it is not within the scope of this project to describe these specific practices in detail.
However, for illustrative purposes, Table 6 on the next page shows a list of 15 interventions for impact mitigation that are applicable to either or both almond and soy farming, and could be used to bring farms within ecological boundaries. All the listed interventions are applicable to both farm types, with the exception of #3, cover cropping, which can only be applied on soy farms. The table includes a brief description of each intervention as well as an indication of the impact areas it involves. The broader the range of impact areas an intervention can mitigate, the less likely it is to cause new problems in areas outside of its scope of benefit. The interventions in the table are therefore listed roughly in order of their breadth of impact (from broadest to most specific). For more detailed descriptions of these interventions at a farm level, see Appendix A3.

A tempting approach for a company could be simply to move away from suppliers that are crossing certain ecological boundaries and instead buy their products from suppliers operating within the safe operating space. Though this will result in a “quick fix” improvement in the company’s overall impact footprint, it is not the pathway that is most likely to yield lasting change towards more sustainable agriculture. The farmers that the company does not buy from will likely find other buyers for their products, whose sourcing requirements are less stringent. In this situation, the company would miss the opportunity to foster collaborative progress towards a sustainable supply chain. We therefore recommend companies to explore the best ways to work with all of its suppliers, even those who are lagging significantly in their environmental performance.


Interventions for the Rio Canaleta Almond Farms
Applying our combined insights thus far to the situation we have observed for Farms 1, 2, and 3, we can explore how crafting a mitigation strategy may play out in practice. For these almond farms, the most severely transgressed boundaries clearly appear to be those around land-use and biodiversity. Thus, the top priority here would be to implement measures to increase biodiversity and reduce the impacts of anthropogenic land-use to the greatest extent possible (through a combination of land-sparing and land-sharing techniques).
As we have shown, this particular sub-basin has an unusually high level of Natural Intact Vegetation. If the basic premise of our land-use boundary approach is accepted, then the Rio Canaleta sub-basin may well be a prime location for rewilding over the long run (though we cannot conclude this definitively based on the current research). The Rio Canaleta already has a significant segment of core habitat, which would probably lend itself to expansion or connection with other pieces of core habitat through corridor development.
Achieving a rewilding objective in this area, however, would likely require long-term planning over the course of decades – slowly shifting agricultural activities into alternative areas as almond trees age and farmers retire. Thus, a rewilding strategy would need to be planned and coordinated by a higher-level authority such as a cooperative or a local government. In the intervening years before the implementation of such a plan is likely to be possible, there are many other approaches that can be taken to increase farm-level biodiversity. For instance, farms in close proximity to nature areas should, in all likelihood, dedicate more space than usual to constructed biotopes such as hedgerows or buffer zones (intervention 2 in Table 6). Ideally, the results of a local land-use assessment would also reveal priority species in the area, which require the presence of specific ecological features that the farms could then supply.
A recommendation that we can make for all of the farms studied is that the removal of vegetation in between the rows of almond trees is almost certainly having a net negative impact on overall biodiversity in the area, and is particularly problematic in this high-NIV basin. It is, in fact, likely that applying agroforestry-like practices (such as putting rows of native flowering plants in between the trees, or intercropping with another crop; intervention 1 in Table 6) is likely to further increase biodiversity and support pollinator populations. We recommend the implementation of such measures on a number of high-priority farms in the area, coupled with a monitoring program to observe impacts on local biodiversity and crop yields.
As described in the biodiversity footprint chapter, there are likely to be tensions between increasing biodiversity on an individual farm (through extensive farming practices that are often implemented on organic / ecological farms) and the overall land-use demand. Though ecological farms perform well on many dimensions of sustainability and have, on average, 30% more species abundance than conventional farms (Bengtsson et al., 2005), yields on Alpros organic farms are generally lower, requiring more land-use overall. Though this may seem to point towards an outright preference for conventional farming, the situation is made more complicated by the fact that, as described in the land-use chapter, some species thrive specifically in extensive farmland habitats. These landscapes, therefore, provide mixed benefits: food production outputs as well as habitat for specific species. Moreover, these extensive farming landscapes can potentially serve as corridors between core habitat areas, potentially contributing to the functional increase of natural area from the perspective of certain species (even if these farms are not nearly as biodiverse as untouched ecosystems).
An important direction for solutions could, therefore, be to maintain these extensive biodiversity supporting agricultural landscapes (in combination with some zones of high-intensity production), but focus on increasing their yields. A variety of practices have been found to increase yields on organic farms, though not without higher environmental risk (Röös et al., 2018). One clear way that at least some of the farms we evaluated could improve their yields is by increasing nitrogen fertilizer application where it is currently being under-applied. However, this has to be done carefully, since excess fertilizer application is broadly considered to be one of the more environmentally damaging measures for raising yields (ibid.). A second avenue to increase yields in ecological farms is to irrigate almond trees. In the Rio Canaleta sub-basic for example, water use is still within a safe operating space. Therefore, the yield per hectare of the ecological farm could be increased through irrigation, thereby optimising production while moving the farm towards better land use targets through nature-friendly farming practices. A more extensive agronomic analysis should ideally be conducted to understand which factors are most significantly limiting growth on these extensive farms to see if any of these factors can be eliminated without creating new pressures.
Aside from addressing the most urgent issues (biodiversity and land-use), we still strongly recommend that all farms follow best practices when it comes to water management, fertilizer application, soil care, and other processes. As mentioned in the water chapter, even though none of the farms studied are contributing to the transgression of freshwater balance boundaries, it is still prudent to monitor tree evapotranspiration and apply optimization and efficiency measures (e.g., buffer strips to reduce evapotranspiration loss due to wind), especially during the drier summer months (April-October). It is always possible that pressures in this basin will fluctuate or increase as precipitation patterns change due to climate change. The most efficient farms will benefit from greater resilience.

Dealing with trade-offs
In the case of Farms 1, 2, and 3, biodiversity loss and land-use appear to be the clear priorities in terms of developing a mitigation strategy. However, if a farm is transgressing all boundaries, the situation can potentially be much more complex. In such a situation, it is essential to understand the degree to which each of the boundaries is being transgressed by the individual farm – and also, to understand the degree to which that farm may be contributing to approaching a local tipping point. For example, if a farm is upstream of the last stretch of a particular type of native aquatic ecosystem, then its direct nitrogen deposition into water will likely be a priority focal area. If more biodiversity impact will be caused by excess nitrogen releases than from the land savings that can potentially be achieved as a result of increased yields, then the clear solution is to prioritize nitrogen emissions reduction.
It is important to note that though such impact trade-offs can be made somewhat intuitively, to roll out a boundary-based assessment approach more broadly will require the development of an impact prioritization scheme that will allow for the consistent optimization of interventions.

Discussion
This pilot offered our research consortium the opportunity to develop and test a broad range of methods for science-based target setting. Such an open and collaborative process naturally facilitated a great deal of progress on these topics. However, as it was intended to, the process also revealed gaps, shortcomings, and new questions to resolve in the next steps of this research. Some of the emergent conclusions and discussion points include:
- A systemic approach is essential.An important higher-level finding of this study is that the evaluation of impact areas against boundaries should not occur in isolation, but rather, must be looked at coherently as part of a single assessment. A systemic perspective allows for the comprehensive evaluation of trade-offs between competing objectives and also ensures consistency in methodologies and measurement techniques. We attempted to bring all four separate research trajectories together at the end of the previous chapter, however, there are some inconsistencies between the methodologies that have made comparisons more challenging. For example, the biodiversity team used their own water data rather than taking the results of the freshwater team as an input. Since all methodologies were under development simultaneously under a strict timeline, it was practically impossible to develop them sequentially and use the outputs of one team’s research as the inputs into the next team’s research. However, once these kinds of methodologies are finalized, it will be important to identify the correct order of calculations and conduct each boundary assessment in the proper sequence.
- Missing: an approach for evaluating trade-offs. There is currently no system for prioritizing between competing impact mitigation objectives (which involve “apples to oranges” comparisons). Such a prioritization scheme will need to be based on both scientific knowledge and moral values, meaning that it is likely to be contentious because it ultimately needs to rest on personal judgments (for example, what do we value more: marginal improvements in human health for a large population, or the preservation of an insect species from extinction?). However, without at least some form of agreed-upon principles – perhaps in the form of a decision-tree – for trading off between different impacts, it will be challenging to come to actionable mitigation strategies for multiple boundaries simultaneously. We recommend that the various NGOs and networks currently engaged in the science-based targets movement support the development of such a prioritization system.
- Not all boundaries were fully evaluated. For some of the boundaries that we planned to set targets for, there are more tipping points that should ultimately be evaluated than we were able to consider in this pilot. For example, not just local nitrogen deposition and aquatic nitrogen concentrations should be considered when looking at a nitrogen boundary, but also more aggregated downstream impacts such as the effect of nitrogen on coastal eutrophication (see Figure 10 for full overview of possible nitrogen tipping points). Moreover, for the biogeochemical flows boundary, we only considered nitrogen and not phosphorus – which should also ultimately be included. Likewise, as mentioned, we did not evaluate all the dimensions of land use impact (for example, we did not consider potential tipping points resulting from land-use change in the dimension of carbon sinks, water cycles, or biogeochemical flows, which should also all ultimately be considered). The biodiversity footprint methodology also does not consider all relevant dimensions for the assessment of this impact. Biodiversity is a multifaceted concept that requires multiple indicators to properly monitor. One relevant dimension is “species abundance,” or the total number of individuals within a specific species. Other dimensions are “distribution,” which considers the patterns and locations of species distribution in a landscape, “composition,” which has to do with species diversity, and “extinction risk” which considers whether any specific species are at high risk of extinction. The global boundary for biodiversity considers two primary dimensions: genetic and functional biodiversity. It is clear that more progress is needed in further developing and expanding some of the methodologies that have been tested in this pilot in order to achieve a more accurate measure of risk in these impact areas.
- Spatial and temporal dimensions: more resolution needed.As discussed in the introduction, the evaluation of the boundaries selected in this study requires both spatial and temporal resolution (at different scales, depending on the particular impact area in question). Though progress was made in this respect, and we believe we have identified the appropriate spatial and temporal scales for some of these boundaries (e.g., freshwater evaluations on a sub-basin level), there is more work to be done in this regard for some of the indicators. For example, for the aquatic concentration of nitrogen, we only had a single measured data point collected at the Ebro river site closest downstream of Farms 1, 2, and 3. Our model, on the other hand, shows that nitrogen concentrations are likely to fluctuate dramatically based on environmental conditions such as precipitation and changes in local vegetation cover. Ideally, more empirical data would be available to cross-reference our models. This would lead to improved algorithms and to a better understanding of the appropriate temporal scale for a nitrogen boundary (should it be defined monthly, weekly, or even daily? This depends on the nature of the fluctuations). As another example, the biodiversity footprint methodology only considers a current state snapshot comparison between the current activity (e.g., conventional farming) and a fully natural state. It does not take into account a temporal dimension – for example, comparing the biodiversity impacts of farming under conventional or organic agriculture over a period of 10, 20 or 50 years. Since organic agriculture has been broadly shown to reduce soil erosion and improve long-term productivity, it is possible that on a longer timescale, this practice would come out more favorably relative to conventional agriculture, despite its poorer yield over the short term.
- Further work needed on allocation principles. Though we explored possible approaches to allocation, it is clear that more work is needed in this area to develop a methodology that consistently results in sensible outcomes. In some cases, it is clear that allocation is not needed: when the responsibility for an impact is entirely in the hands of a single actor; when there is consensus that a level of “zero impact” is the only acceptable level. Both of these cases are discussed in the allocation section of the nitrogen boundary chapter. However, in cases where there are multiple actors jointly contributing to the transgression of a boundary that they all influence (e.g., freshwater consumption from a single sub-basin), allocation becomes necessary. We recommend the development of an allocation method specifically tailored to the agricultural sector that also considers the geographical appropriateness and nutritional value of different products (among other potential parameters).
- Ground-truthing and peer review needed. The results of this research make it clear that though the methodologies developed hold promise, they need further development, ground-truthing, and peer review. With the results of this ground-truthing, we will be able to more accurately assess which of these methodologies show the greatest promise, and to evaluate the degree to which contextual, spatial, and temporal data is necessary to provide accurate guidance on a farm level. For instance, the biodiversity footprint methodology, which is the only one of the methods that is not inherently geospatial and contextual, may perhaps be better suited as a primary screening approach to identify likely biodiversity loss “hotspots,” which can then be further assessed using the land-use methodology approach in order to prioritize different types of practices on different parcels of land.
- Social impacts of Science-Based Targets. In the implementation of interventions for any transgressed boundary, there are a range of stakeholders that may be involved and affected (Figure 21). Some interventions can be targeted at the farm level, such as adoption of more nature-friendly production practices, while others are complex and involve the coordination and alignment of activities at a range of scales. In all cases, interventions should seek to, where possible, simultaneously improve conservation, production, and livelihood objectives. Where trade-offs occur, decision-making should be conducted through self-organized, participatory processes which are informed by robust scientific knowledge. The implementation of science-based targets can be seen as a social process informed by science, not determined by it.
One final point of discussion we would like to consider, which also implies further research, is that we need a better understanding of the per capita “budgets” that are available for the different impact areas under consideration. These are also likely to be divided highly unevenly between different geographies. There are many calculated estimates for what per capita CO2-eq emissions should be capped at annually (estimated at 1.2 tonnes per annum based on O’Neill et al., 2018). However, the understanding of how much land we can each use per capita to fulfill our dietary requirements if we wish to leave half of the world’s natural areas intact is not as commonly studied or discussed in public. In their pre-publication of the EAT Lancet report, Springmann and colleagues (2018) have shown for example that a combination of technological interventions in the food system and dietary changes towards more plant-based nutrition is needed to meet future dietary requirements while staying within planetary boundaries. We need to further build out such a narrative so that we can better understand how to prioritize different kinds of land resources for fiber, food, or fuel. Having a fuller picture of these constraints and their interactions will also help us determine the degree to which dramatic changes are necessary in the agricultural system if we wish to create food value chains that are genuinely within the boundaries of our one planet.

Next steps
There are many next steps that emerge from our findings – ranging from necessary technical adjustments to the methodologies, to broader inquiries that should be taken up by the entire science-based targets movement. We do not mention the method-specific improvements here, as they are described in the sections on each methodology. Some of the higher-level research directions, already mentioned in the concluding chapters of this report, include:
- Building upon the methodologies tested in this report.As already discussed, there is a great deal of work to be done in further refining and expanding the methods tested here – from integrating more temporal resolution to assessing additional tipping points. The models should be ground-truthed and peer-reviewed.
- Scaling and automation. Once the methods are further refined, it is important to work towards possibilities for scaling these approaches through automation. Ideally, a large portion of the necessary data for calculating localized science-based targets can be acquired through remote sensing or available datasets. With some basic tooling in place, additional pilots can be run with a much larger number of farms. This topic is briefly explored further in Box 1.
- Development of agriculture-specific allocation approaches. A gap identified in our research is the development of an allocation method specifically tailored to the agricultural sector. This method should ideally consider parameters such as the geographical suitability and nutritional value of different products. Such an approach should ideally be developed in the context of a pilot with local stakeholders to test out the technical implications, feasibility, acceptance, and appropriateness of different allocation approaches and their outcomes.
- Development of a working agreement for prioritizing between trade-offs. We recommend that the various NGOs and networks currently engaged in the science-based targets movement support the development of a system (or decision-tree approach) that can be used for the prioritization of different mitigation approaches. This is essential when considering multiple boundary transgressions of different types.
- Development of a better understanding of the per capita “budgets” for land, freshwater, and other common resources. We currently have a poor understanding of how the planetary boundaries (or regional boundaries) will translate to a per-capita “safe operating space” in different regions. This makes it challenging to understand how much land we should ideally be allocating to different food groups or for the production of other resources, like fiber for clothing.
Box 1: Possibilities for automation and scaling
In order for science-based target setting to become feasible and affordable for a broad range of stakeholders, it must become faster and easier to implement. One of the most likely mechanisms to achieve this outcome is through software-based automation and remote data collection (through satellites and sensors). To explore the implications and potential requirements of automation, here we consider the data requirements for one of the nutrient boundaries that we calculated. Similar exercises can be conducted for other impact areas and their boundaries.
The approach we used in this pilot for setting a farm-level nutrient boundary has the potential to be replicated on a larger scale with a combination of existing datasets and manual data inputs. In order to do this, a variety of questions need to be considered, particularly whether the data is replicable across regions. Some variables such as background nitrogen deposition and precipitation rates are location-specific and would require linking of the dataset to a global map. Other factors such as volatilization require input from the farmer on the type and amount of fertilizer applied to the field. Some of these values are static, meaning the values are applicable across all spatial and temporal scales. Others are dynamic, meaning they would change based on location or timing. An overview of the potential data requirements are outlined in Table 7. Further analysis should explore whether the data requirements are available on a local and regional scale to identify where data gaps need to be filled.
Based on this table, we see that a majority of the required data types could feasibly be collected through an automated approach. The four data inputs that need manual input would need to be collected through an annual farm survey, which most cooperatives and buyers already require of their suppliers. Ideally, some of the dynamic data would ultimately be collected through field-based sensors (in order to increase accuracy and temporal resolution). However, in the case that this is cost-prohibitive, literature sources can be used as a stand-in.

Next steps for Alpro
In addition to these higher-level research questions, some of which will have direct bearing on Alpro’s continuation of this work within its own supply chain, there are specific activities that we believe Alpro should undertake as a next, value-adding step in continuing this pilot.
Our primary recommendation is to further develop the land-use methodology we have described in this report as the basis for a larger pilot with the continued active involvement of Alpro’s farming cooperative and its farmers. The land-use methodology provides a geospatial assessment framework on which all other methodologies can be further built, providing an integrated management and monitoring lens for the different issue areas at hand (from freshwater to biodiversity). It is clear from our work thus far, that technical issues notwithstanding, the next essential step with this work must bring the farmers and other affected stakeholders into a central dialogue on how to move forward.

The land-use tool we envision will provide essential scientific input into how land should be managed to optimize for productivity, biodiversity, and the management of other resources within a landscape and region. However, ultimately, these inputs will need to be interpreted in a decision-making process by the local farmers. Alpro, in collaboration with its farming cooperative partners, can initiate and host this stakeholder engagement process as a core part of the next phase of the pilot.
To support farmers in the transition towards operating within planetary boundaries, various measures will ultimately need to be applied. A farm-level toolkit (which could be modeled on the Biodiversity Monitor that has been developed by WWF-Netherlands for Dutch dairy farmers) could be a useful resource for identifying the most suitable farm-level interventions. It is likely that the stakeholder dialogue will also result in radically new approaches for sharing the responsibility of sustainable agriculture within a region, which may necessitate a new way of working. For example, new financial incentives may need to be designed to reward farmers who are protecting biodiversity and ecosystem services. The results of these efforts should be continuously monitored for their effectiveness with adjustments made as necessary.
Though there is still a long road to travel as we move towards an agricultural system that operates within the boundaries of our one planet, the progress made through this research is a testament to the power of collaboration between sectors. With rapid cycles of learning, which can only be achieved through openness to potential failure, we hope to quickly move towards scalable and replicable approaches for addressing human needs while allowing nature to thrive.
Glossary
Planetary Boundary
Nine essential Earth systems that need to be kept stable in order to keep the biosphere functioning. An attempt has been made to define boundaries that represent the amount of change each of these parameters can absorb without hitting an unsafe and destabilizing level. Out of the nine boundaries identified, SRC has estimated that we have already transgressed four: climate change, biodiversity loss, both phosphorus and nitrogen biogeochemical flows, and land system change.
Tipping Point
A tipping point is a threshold for abrupt irreversible changes (regime shifts). A tipping point has been crossed when a system enters a significantly different state as the result of a small alteration.
Tipping Element
A tipping element is a large-scale component of the Earth system that may pass a tipping point. Well-known tipping elements in the climate system include the Greenland ice sheet and the Atlantic thermohaline circulation.
Land-Sparing
Land sparing refers to a dichotomy of yield maximising and habitat conservation on separate patches of land. At the core of the approach is the idea that high-yield production on agricultural land will meet society’s needs for food, fuels and fibres, and “spare” more land for nature conservation. Criticisms of land-sharing are that the expansion of intensive agriculture beyond these production needs will not be managed without strong protection measures for conservation lands, and that islands of protected land surrounded by intensive agriculture are not structurally supportive of many species.
Land-Sharing
Land sharing is an alternative to land sparing. That is, the adoption of biodiversity-friendly agricultural practices which seek to manage trade-offs between production and habitat provision. Criticisms of land sharing are that the reduced yield production requires more land to produce adequate food and fibres.
Landscape
A landscape is a mosaic of interconnected natural and anthropogenic ecosystems, which provide a range of good and services such as food, fibres, livelihoods and habitats. Landscapes can been understood as a scale to operationalise complex spatial sustainability challenges through a process of collaborative planning and management between stakeholders.
Natural Intact Vegetation (NIV)
NIV is the remaining natural vegetation area as a percentage of the originally-vegetated area.
Biome
A biome is a distinct community of plants and animals that are climate rather than location specific. Biomes can be freshwater, marine, and terrestrial. Examples of biomes are tropical and subtropical moist broadleaf forest, montane grasslands and shrublands, tundra, and Mediterranean woodland, forest and scrub.
Blue Water
Is water that has been sourced from surface or groundwater resources and is either evaporated, incorporated into a product or taken from one body of water and returned to another, or returned at a different time.
Green Water
Water from precipitation that is stored in the root zone of the soil and evaporated, transpired or incorporated by plants. It is particularly relevant for agricultural, horticultural and forestry.
References
Alkemade, J. R. M., M. van Oorschot, L. Miles, C. Nellemann, M. Bakkenes and B. ten Brink. (2009). GLOBIO3: A framework to investigate options for reducing global terrestrial biodiversity loss. Ecosystems 12:374-390.
Almond Board of California. (1973). Why should you adopt good agricultural practices? Retrieved from http://www.almonds.com/sites/default/files/content/attachments/gap-quick-start-guide_1.pdf
Arets, E. J. M. M., C. Verwer and R. Alkemade. (2014). Meta-analysis of the effect of global warming on local species richness WOt paper 34. Statutory Research Tasks Unit for Nature & the Environment, Wageningen UR.
Arets, E. J. M. M., W. v. Rooij, J. Struijs, W. Broer, J. Schaick, G. W. W. Wamelink, M. H. C. van Adrichem and P. C. Jansen. (2017). Biodiversiteitsvoetafdruk van bedrijven. http://edepot.wur.nl/421554.
Ashley, R., Russell, D., & Swallow, B. (2006). The policy terrain in protected area landscapes: challenges for agroforestry in integrated landscape conservation. Biodiversity & Conservation, 15(2), 663-689.
Baas, D., Casteel, S., Clay, D., Clay, S., Gross, P., Hoorman, J., Hoormann, R., Kaspar, T., Kladivko, E., Ruark, M., Millar, N., Murray, H., Noggle, S., Wyse, D. (2015) Integrating Cover Crops in Soybean Rotations Challenges and Recommendations for the North Central Region. Retrieved from the Midwest Cover Crops Council: http://www.soybeanresearchinfo.com/Integrating_CoverCrops_Soybeans2015.pdf
Bai, Z. G., Dent, D. L., Olsson, L., & Schaepman, M. E. (2008). Global assessment of land degradation and improvement: 1. identification by remote sensing (No. 5). ISRIC-World Soil Information.
Balmford, A., T. Amano, H. Bartlett, D. Chadwick, A. Collins, D. Edwards, R. Field, P. Garnsworthy, R. Green, P. Smith, H. Waters, A. Whitmore, D. M. Broom, J. Chara, T. Finch, E. Garnett, A. Gathorne-Hardy, J. Hernandez-Medrano, M. Herrero, F. Hua, A. Latawiec, T. Misselbrook, B. Phalan, B. I. Simmons, T. Takahashi, J. Vause, E. zu Ermgassen and R. Eisner. (2018). The environmental costs and benefits of high-yield farming. Nature Sustainability 1:477-485.
Barral, M. P., Benayas, J. M. R., Meli, P., & Maceira, N. O. (2015). Quantifying the impacts of ecological restoration on biodiversity and ecosystem services in agroecosystems: a global meta-analysis. Agriculture, Ecosystems & Environment, 202, 223-231.
Battye, W., Aneja, V. P., & Schlesinger, W. H. (2017). Is nitrogen the next carbon ? Global Biogeochemical Cycles, 30, 1000–1014. https://doi.org/10.1002/eft2.235
Bengtsson, J., Ahnstrom, J., Weibull, A. (2005). The effects of organic agriculture on biodiversity and abundance: a meta-analysis. Journal of Applied Ecology 42: 261-269
Bjørn, A., Bey, N., Georg, S., Røpke, I., & Hauschild, M. Z. (2017). Is Earth recognized as a finite system in corporate responsibility reporting?. Journal of Cleaner Production, 163, 106-117.
Blaschke, T. (2010). Object based image analysis for remote sensing. ISPRS journal of photogrammetry and remote sensing, 65(1), 2-16.
Bobbink, R., & Hettelingh, J. P. (2011). Review and revision of empirical critical loads and dose-response relationships: Proceedings of an expert workshop, Noordwijkerhout, 23-25 June 2010. Rijksinstituut voor Volksgezondheid en Milieu RIVM.
Borma, L. D. S., & Nobre, C. A. (2016). Secas na Amazônia: causas e consequências. Oficina de Textos.
Bouwman, A.E. (1995). Compilation of a global inventory of emissions of Nitrous Oxide. Ph.D. thesis, University of Wageningen, Netherlands.
Brentrup, F., Küsters, J., Lammel, J., & Kuhlmann, H. (2000). Methods to estimate on-field nitrogen emissions from crop production as an input to LCA studies in the agricultural sector. The International Journal of Life Cycle Assessment, 5(6), 349.
Brisbane Declaration (2007). The Brisbane Declaration: environmental flows are essential for freshwater ecosystem health and human well-being. 10th International River Symposium, 3–6 September 2007, Brisbane.
Browde, J., Ohmart, C., Ludwig, G. (2015) Ecosystem Management. Retrieved from California Almond Sustainability Program: https://www.almonds.com/sites/default/files/ecosystem_management.pdf
Brown, P. (2013). Management of Nitrogen in Almonds and Pistachios: New Leaf Sampling and Nutrient Budgets for Almond and Pistachio. Presentation: University of California, Davis.
Bryan, B. A., Perry, L. M., & Gerner, D. (2004). An interactive spatial optimisation tool for systematic landscape restoration.
Buck, L. (2018). Biodiversity and Agricultural Production Practices Toolkit.
Carwardine, J., Hawkins, C., Polglase, P., Possingham, H. P., Reeson, A., Renwick, A. R., … & Martin, T. G. (2015). Spatial priorities for restoring biodiverse carbon forests. BioScience, 65(4), 372-382.
Cazcarro, I., Duarte, R., Martín-Retortillo, M., Pinilla, V., & Serrano, A. (2015). How Sustainable is the Increase in the Water Footprint of the Spanish Agricultural Sector? A Provincial Analysis between 1955 and 2005–2010. Sustainability, 7(5), 5094–5119.
CBD. (2014). Global Biodiversity Outlook 4. Secretariat of the Convention on Biological Diversity, Montreal, Canada. https://www.cbd.int/gbo/gbo4/publication/gbo4-en.pdf.
CCME. (2013). Canadian Water Quality Guidelines for the Protection of Aquatic Life; Canadian Council of Ministers of the Environment: Winnipeg, Canada, 2013.
CDP. 2013. “Sector insights: What is driving climate change action in the world’s largest companies?” Global 500 Climate Change Report 2013.
Chamberlain, D. E., Fuller, R. J., Bunce, R. G., Duckworth, J. C., & Shrubb, M. (2000). Changes in the abundance of farmland birds in relation to the timing of agricultural intensification in England and Wales. Journal of applied ecology, 37(5), 771-788.
Chartzoulakis, K., & Bertaki, M. (2015). Sustainable Water Management in Agriculture under Climate Change. Agriculture and Agricultural Science Procedia, 4, 88–98. https://doi.org/10.1016/j.aaspro.2015.03.011
Chartzoulakis, K., & Bertaki, M. (2015). Sustainable Water Management in Agriculture under Climate Change. Agriculture and Agricultural Science Procedia, 4, 88–98. https://doi.org/10.1016/j.aaspro.2015.03.011
Chazdon, R. L. and Guariguata, M. R. (2017). Decision support tools for forest landscape restoration.
Clark, A. (2007) Managing Cover Crops Profitably. Retrieved from Sustainable Agriculture Research and Education: https://www.sare.org/Learning-Center/Books/Managing-Cover-Crops-Profitably-3rd-Edition/Text-Version
Cleveland, C.C., Houlton, B.Z., Smith, W.K., Marklein, A.R., Reed, S.C., Parton, P., Del Grosso, S.J., & Running, S.W. (2013). Patterns of new versus recycled primary production in the terrestrial biosphere, Proceedings of the National Academy of Sciences, 110(31): 12733-12737.
Confederación Hidrográfica del Ebro (2016). Ebro River Basin Management Plan 2015 – 2017. Retrieved at: http://www.chebro.es/contenido.visualizar.do?idContenido=42695&idMenu=4780
Confederación Hidrográfica del Ebro (2016a). Ebro River Basin Management Plan 2015 – 2017. Anejo V: Estudios previous para la appoximación téchnica a Los Caudales ecológicos de la Cuenca del Ebro. Retrieved at: http://www.chebro.es:81/Plan%20Hidrologico%20Ebro%202010-2015/Memoria/7.-%20Anejos/05.-%20Caudales%20ecol%C3%B3gicos/A05Qeco_V2_4.pdf
Confederación Hidrográfica del Ebro (2018) Plan especial de sequías. Anexo 3. Fichas de caracterización y descripción de sequías históricas recientes. Retrieved at: ftp://ftp.chebro.es/informes/Sequia/PES/Anexo3_FichasSequiasHistoricas.pdf
Cooperative Report. (2018). Eco-sustainability Study report – Carbon footprint almond paste.
(CTIC), C. T. I. C. (2017). Tillage type definitions. Retrieved October 23, 2018, from http://www.ctic.purdue.edu/resourcedisplay/322/
Czymmek, K., Ketterings, Q. (2012) Nutrient Management Spear Program: Applied Research, Extension and Teaching in Nutrient Management for Dairy/Cash Grain Farm. Retrieved from Department of Animal Science Cornell University: http://nmsp.cals.cornell.edu/publications/NMSP_9_28_2012.pdf
Dinerstein, E., Olson, D., Joshi, A., Vynne, C., Burgess, N. D., Wikramanayake, E., … & Hansen, M. (2017). An ecoregion-based approach to protecting half the terrestrial realm. BioScience, 67(6), 534-545.
Dirzo R., Young H.S., Galetti M., Ceballos G., Isaac N.J. & Collen B. (2014). Defaunation in the Anthropocene. Science 345:401–6.
Dordevic, V., Malidz, G., Vidic, M., Milovac, Z., & Seremesic, S. (2016). Best practise manual for soya bean cultivation in the danube region. Vienna.
Dragut, L. and Blaschke, T. (2006). Automated classification of landform elements using object-based image analysis. Geomorphology, 81(3):330–344.
EEA (2010). Critical load exceedance for nitrogen (SEBI 009). Accessed at http://www.eea.europa.eu/data-and- maps/indicators/critical-load-exceedance-for- nitrogen/critical-load-exceedance-for-nitrogen.
E. O. Wilson (2016) Half-Earth: Our Planet’s Fight for Life, WW Norton & Company.
Erisman, J. W., Galloway, J. N., Seitzinger, S., Bleeker, A., Dise, N. B., Petrescu, A. R., … & de Vries, W. (2013). Consequences of human modification of the global nitrogen cycle. Phil. Trans. R. Soc. B, 368(1621), 20130116.
European Commission. (1991). Council Directive of 12 December 1991 Concerning the Protection of Waters Against Pollution Caused by Nitrates from Agricultural Sources (Directive 91/676/EEC). Retrieved from: http://ec.europa.eu/environment/water/water-nitrates/index_en.html
Fabre, J., Ruelland, D., Dezetter, A., & Grouillet, B. (2016). Sustainability of water uses in managed hydrosystems: human- and climate-induced changes for the mid-21st century. Hydrol. Earth Syst. Sci., 20, 3129-3147.
FAO (2014). Facts and Figures about Retrieved at: http://www.fao.org/nr/water/aquastat/didyouknow/index3.stm
FAO (1994). Interactions between Livestock Production Systems and the Environment. Accessed at http://www.fao.org/wairdocs/lead/x6123e/x6123e06.htm.
Flanders, D., Hall-Beyer, M., and Pereverzoff, J. (2003). Preliminary evaluation of ecognition object-based software for cut block delineation and feature extraction.Canadian Journal of Remote Sensing, 29(4):441–452.
Forman, R. T., & Alexander, L. E. (1998). Roads and their major ecological effects. Annual review of ecology and systematics, 29(1), 207-231.
Franke, N. A., Boyacioglu, H., & Hoekstra, A. Y. (2013). Grey water footprint accounting: Tier 1 supporting guidelines. Delft: UNESCO-IHE.
Freitas, S. R., Hawbaker, T. J., & Paul, J. (2010). Effects of roads, topography, and land use on forest cover dynamics in the Brazilian Atlantic Forest. Forest Ecology and Management, 259, 410–417.
Generalitat de Catalunya (2017). Sistema d’informació geogràfica de parcel·les agrícoles. Accessed at: https://analisi.transparenciacatalunya.cat/en/Medi-Rural-Pesca/Sistema-d-informaci-geogr-fica-de-parcel-les-agr-c/3ff4-ikh6
Gourevitch, J. D., Hawthorne, P. L., Keeler, B. L., Beatty, C. R., Greve, M., & Verdone, M. A. (2016). Optimizing investments in national-scale forest landscape restoration in Uganda to maximize multiple benefits. Environmental Research Letters, 11(11), 114027.
Greve, M., Reyers, B., Lykke, A. M., & Svenning, J. C. (2013). Spatial optimization of carbon-stocking projects across Africa integrating stocking potential with co-benefits and feasibility. Nature communications, 4, 2975.
Guardia, G., Tellez-Rio, A., García-Marco, S., Martin-Lammerding, D., Tenorio, J. L., Ibáñez, M. Á., & Vallejo, A. (2016). Effect of tillage and crop (cereal versus legume) on greenhouse gas emissions and Global Warming Potential in a non-irrigated Mediterranean field. Agriculture, ecosystems & environment, 221, 187-197.
Gulhane, P. A., Gomashe, A. V, & Sundarkar, K. M. (2015). Influence of Pesticides on Nitrogen Fixing Bacteria. International Journal of Technical Research and Applications, 3(4), 157–160. Retrieved from www.ijtra.com
Haifa (2017). Nutrients rates ideal for growing almonds in Spain – The recommended rates of nutrients and fertilizers needed to grow healthy almond trees. Accessed at https://www.haifa-group.com/nutrients-rates-ideal-growing-almonds-spain.
Hanafiah, M. M., A. J. Hendriks and M. A. J. Huijbregts. (2012). Comparing the ecological footprint with the biodiversity footprint of products. Journal of Cleaner Production 37:107-114.
Hernando, A., Velázquez, J., Valbuena, R., Legrand, M., & García-Abril, A. (2017). Influence of the resolution of forest cover maps in evaluating fragmentation and connectivity to assess habitat conservation status. Ecological indicators, 79, 295-302.
Hewitt, R., Van Delden, H., & Escobar, F. (2014). Participatory land-use modelling, pathways to an integrated approach. Environmental modelling & software, 52, 149-165.
Hoekstra, A.Y., Chapagain, A.K., Aldaya, M.M and Mekonnen, M.M (2011). The Water Footprint Assessment Manual: Setting the Global Standard. EarthScan
Hooke, J., & Sandercock, P. (2012). Use of vegetation to combat desertification and land degradation: Recommendations and guidelines for spatial strategies in Mediterranean lands. Landscape and Urban Planning, 107(4), 389–400. https://doi.org/10.1016/j.landurbplan.2012.07.007
IPCC (2014). Climate Change 2014: Synthesis Report. Contribution of Working Groups I, II and III to the Fifth Assessment Report of the Intergovernmental Panel on Climate Change [Core Writing Team, R.K. Pachauri and L.A. Meyer (eds.)]. IPCC, Geneva, Switzerland, 151 pp.
IPCC (2018). Global warming of 1.5°C. An IPCC Special Report on the impacts of global warming of 1.5°C above pre-industrial levels and related global greenhouse gas emission pathways, in the context of strengthening the global response to the threat of climate change, sustainable development, and efforts to eradicate poverty [V. Masson-Delmotte, P. Zhai, H. O. Pörtner, D. Roberts, J. Skea, P.R. Shukla, A. Pirani, W. Moufouma-Okia, C. Péan, R. Pidcock, S. Connors, J. B. R. Matthews, Y. Chen, X. Zhou, M. I. Gomis, E. Lonnoy, T. Maycock, M. Tignor, T. Waterfield (eds.)]. In Press.
Janse, J. H., J. J. Kuiper, M. J. Weijters, E. P. Westerbeek, M. H. J. L. Jeuken, M. Bakkenes, R. Alkemade, W. M. Mooij and J. T. A. Verhoeven. (2015). GLOBIO-Aquatic, a global model of human impact on the biodiversity of inland aquatic ecosystems. Environmental Science & Policy 48:99-114.
Jose, S. (2009). Agroforestry for ecosystem services and environmental benefits: An overview. Agroforestry Systems, 76(1), 1–10. https://doi.org/10.1007/s10457-009-9229-7
Kerkhof, A. and W. Terlouw. (2015). Life Cycle Assessment of Alpro Plain Calcium Almond Drink. ECOFYS Netherlands bv, Utrecht, the Netherlands.
Knapp, S., O. Schweiger, A. Kraberg, H. Asmus, R. Asmus, T. Brey, S. Frickenhaus, J. Gutt, I. Kühn, M. Liess, M. Musche, H.-O. Pörtner, R. Seppelt, S. Klotz and G. Krause. (2017). Do drivers of biodiversity change differ in importance across marine and terrestrial systems — Or is it just different research communities’ perspectives? Science of The Total Environment 574:191-203.
Kok, M. T. J., R. Alkemade, M. Bakkenes, M. van Eerdt, J. Janse, M. Mandryk, T. Kram, T. Lazarova, J. Meijer, M. van Oorschot, H. Westhoek, R. Zagt, M. van der Berg, S. van der Esch, A.-G. Prins and D. P. van Vuuren. (2018). Pathways for agriculture and forestry to contribute to terrestrial biodiversity conservation: A global scenario-study. Biological Conservation 221:137-150.
Kremen, C. (2015). Reframing the land-sparing/land-sharing debate for biodiversity conservation. Annals of the New York Academy of Sciences, 1355(1), 52-76.
Kusters, K. (2015). Climate-smart landscapes and the landscape approach.
Laane, R. W. P. M., Brockmann, U., Van Liere, L., & Bovelander, R. (2005). Immission targets for nutrients (N and P) in catchments and coastal zones: a North Sea assessment. Estuarine, Coastal and Shelf Science, 62(3), 495-505.
Laflen, J. M. (1994). Corine Soil Erosion Risk and Important Land Resources. Soil Science, 157(6), 399-400.
Lambin, E. F., & Geist, H. J. (Eds.). (2008). Land-use and land-cover change: local processes and global impacts. Springer Science & Business Media.
Lassaletta, L., Romero, E., Billen, G., Garnier, J., García-Gómez, H., & Rovira, J.V. (2012). Spatialized N budgets in a large agricultural Mediterranean watershed: high loading and low transfer. Biogeosciences, 9(1), 57-70.
Lenton, T. M., Held, H., Kriegler, E., Hall, J. W., Lucht, W., Rahmstorf, S., & Schellnhuber, H. J. (2008). Tipping elements in the Earth’s climate system. Proceedings of the national Academy of Sciences, 105(6), 1786-1793.
Liu, C., Kroeze, C., Hoekstra, A.Y., Gerbens-Leenes, W. (2012). Past and future trends in grey water footprints of anthropogenic nitrogen and phosphorus inputs to major world rivers. Ecol. Indic. 18(0), 42-49.
Liu, X., Duan, L., Mo, J., Du, E., Shen, J., Lu, X., … & Zhang, F. (2011). Nitrogen deposition and its ecological impact in China: an overview. Environmental pollution, 159(10), 2251-2264.
Liu, X., Zhang, Y., Han, W., Tang, A., Shen, J., Cui, Z., …& Fangmeier, A. (2013). Enhanced nitrogen deposition over China. Nature, 494(7438), 459.
Locke, H. (2014). Nature Needs Half: A necessary and hopeful new agenda for protected areas. Nature New South Wales, 58(3), 7.
López, R., & Justribó, C. (2010). The hydrological significance of mountains: a regional case study, the Ebro River basin, northeast Iberian Peninsula. Hydrological Sciences Journal, 55(2), 223–233.
Lucas, P., & Wilting, H. (2018). TOWARDS A SAFE OPERATING SPACE FOR THE NETHERLANDS.
Lutz, S., & Merz, R. (2016, April). Recent Trends in the Ebro River Basin: Is It All” Just” Climate Change?. In EGU General Assembly Conference Abstracts (Vol. 18, p. 9218).
McBride M.F., Wilson K.A., Burger J., Fang Y.C., Lulow M., Olson D., O’Connell M. and Possingham H.P. (2010). Mathematical problem definition for ecological restoration planning. Ecological Modelling 221:2243–50.
McElroy, M.W., & van Engelen, J.M.L. (2012). Corporate Sustainability Management: The Art and Science of Managing Non-Financial Performance, Routledge
Mekonnen, M. M., & Hoekstra, A. Y. (2015). Global gray water footprint and water pollution levels related to anthropogenic nitrogen loads to fresh water. Environmental science & technology, 49(21), 12860-12868.
Meybeck, M. (1982). Carbon, nitrogen and phosphorus transport by world rivers. Am. J. Sci., 282, 401-450.
Milano, M., Ruelland, D., Dezetter, A., Fabre, J., Ardoin-Bardin, S., & Servat, E. (2013). Modeling the current and future capacity of water resources to meet water demands in the Ebro basin. Journal of Hydrology, 500, 114–126.
Milano, M., Ruelland, D., Dezetter, A., Fabre, J., Ardoin-Bardin, S., & Servat, E. (2013). Modeling the current and future capacity of water resources to meet water demands in the Ebro basin. Journal of Hydrology, 500, 114–126. https://doi.org/10.1016/J.JHYDROL.2013.07.010
Millennium Assessment (2010). Ecosystems and Human Well-being: Current State and Trends. Retrieved at https://www.millenniumassessment.org/documents/document.273.aspx.pdf
Myhre, G., D. Shindell, F.-M. Bréon, W. Collins, J. Fuglestvedt, J. Huang, D. Koch, J.-F. Lamarque, D. Lee, B. Mendoza, T. Nakajima, A. Robock, G. Stephens, T. Takemura and H. Zhang. (2013). Anthropogenic and Natural Radiative Forcing. Pages 659–740 in T. F. Stocker, D. Qin, G.-K. Plattner, M. Tignor, S. K. Allen, J. Boschung, A. Nauels, Y. Xia, V. Bex, and P. M. Midgley, editors. Climate Change 2013: The Physical Science Basis. Contribution of Working Group I to the Fifth Assessment Report of the Intergovernmental Panel on Climate Change. Cambridge University Press, Cambridge, United Kingdom and New York, NY, USA.
Natura 2000 (2018). Natura 2000. Retrieved from: http://ec.europa.eu/environment/nature/natura2000/index_en.htm
Niederholzer, F. (2013, March 14). Nitrogen management in mature almonds. The Almond Doctor, University of California Cooperative Extension. Retrieved from http://thealmonddoctor.com/2013/03/14/nitrogen-management-in-mature-almonds/
Ochoa-Hueso, R., Allen, E. B., Branquinho, C., Cruz, C., Dias, T., Fenn, M. E., … & Stock, W. D. (2011). Nitrogen deposition effects on Mediterranean-type ecosystems: an ecological assessment. Environmental Pollution, 159(10), 2265-2279.
Official Statistics Website of Catalonia (2018). Terra Alta Municipal Figures. Retrieved at: https://www.idescat.cat/emex/?id=37&lang=en#hffffffc000000
O’Neill, D. W., Fanning, A. L., Lamb, W. F., & Steinberger, J. K. (2018). A good life for all within planetary boundaries. Nature Sustainability, 1(2), 88–95. https://doi.org/10.1038/s41893-018-0021-4
Orsi, F., Geneletti, D., & Newton, A. C. (2011). Towards a common set of criteria and indicators to identify forest restoration priorities: An expert panel-based approach. Ecological indicators, 11(2), 337-347.
Oruc, M., Marangoz, A. M., and Buyuksalih, G. (2006). Comparison of pixel-based and object-oriented classification approaches using landsat-7 etm spectral bands.
Pimm, S.L., Jenkins, C.N., and Li, B.V. (2018). How to protect half of Earth to ensure it protects sufficient biodiversity. Science Advances, Vol. 4 (8)
Pinho, P., Theobald, M. R., Dias, T., Tang, Y. S., Cruz, C., Martins-Loução, M. A., … & Branquinho, C. (2012). Critical loads of nitrogen deposition and critical levels of atmospheric ammonia for semi-natural Mediterranean evergreen woodlands. Biogeosciences, 9(3), 1205-1215.
Poore, J. and T. Nemecek. (2018). Reducing food’s environmental impacts through producers and consumers. Science 360:987-992.
Potera, C. (2007). Agriculture: pesticides disrupt nitrogen fixation. Environ Health Perspect,115(12).
Pretty, J., & Bharucha, Z. P. (2015). Integrated pest management for sustainable intensification of agriculture in Asia and Africa. Insects, 6(1), 152–182. https://doi.org/10.3390/insects6010152
Ramos, M. E., Benítez, E., García, P. A., & Robles, A. B. (2010). Cover crops under different managements vs. frequent tillage in almond orchards in semiarid conditions: Effects on soil quality. Applied Soil Ecology, 44(1), 6-14.
Rappaport D.I., Tambosi L.R. and Metzger J.P. (2015). A landscape triage approach: Combining spatial and temporal dynamics to prioritize restoration and conservation.Journal of Applied Ecology 52:590–601.
Renwick, A. R., Robinson, C. J., Martin, T. G., May, T., Polglase, P., Possingham, H. P., & Carwardine, J. (2014). Biodiverse planting for carbon and biodiversity on indigenous land. PloS one, 9(3), e91281.
Richter, B.D., Davis, M.M., Apse, C. and Konrad, C. (2012). A presumptive standard for Environmental flow protection. River Research and Application, Volume 28, pages 1312 – 1321.
ROAM: IUCN and WRI [International Union for Conservation of Nature and World Resources Institute] (2014). A guide to the Restoration Opportunities Assessment Methodology (ROAM): assessing forest landscape restoration opportunities at the national or sub- national level. Working paper (Road-test edition). International Union for Conservation of Nature, Gland, Switzerland. https://portals.iucn.org/library/ sites/library/files/documents/2014-030.pdf
Rockström, J., Karlberg, L., Wani, S.P., Barron, J., Hatibu, N., Oweis, T., Bruggeman, A., Farahani, J., and Qiang Z. (2010). Managing water in rainfed agriculture—The need for a paradigm shift. Agriculture Water Management. Volume 97. Pages 543 – 550
Rockström, J., Steffen, W., Noone, K., Persson, Å., Chapin III, F. S., Lambin, E. F., … & Nykvist, B. (2009). A safe operating space for humanity. nature, 461(7263), 472.
Röös, E., Mie, A., Wivstad, M. et al. Agron. Sustain. Dev. (2018) 38: 14. https://doi.org/10.1007/s13593-018-0489-3
Rybicki, J., Hanski, I (2013). Species–area relationships and extinctions caused by habitat loss and fragmentation. Ecol. Lett. 16, 27–38.
Sabag Muñoz O. and Gladek E. (2017). One Planet Approach – Methodology Mapping and Pathways Forward. Metabolic, Amsterdam.
Sala, O. E., F. S. Chapin, III, J. J. Armesto, E. Berlow, J. Bloomfield, R. Dirzo, E. Huber-Sanwald, L. F. Huenneke, R. B. Jackson, A. Kinzig, R. Leemans, D. M. Lodge, H. A. Mooney, M. Oesterheld, N. L. Poff, M. T. Sykes, B. H. Walker, M. Walker and D. H. Wall. (2000). Global Biodiversity Scenarios for the Year 2100. Science 287:1770-1774.
Saura, S., & Pascual-Hortal, L. (2007). A new habitat availability index to integrate connectivity in landscape conservation planning: comparison with existing indices and application to a case study. Landscape and Urban Planning, 83(2-3), 91-103.
Sloan, S., Jenkins, C. N., Joppa, L. N., Gaveau, D. L., & Laurance, W. F. (2014). Remaining natural vegetation in the global biodiversity hotspots. Biological Conservation, 177, 12-24.
Slonecker, E. T., Barnes, C., Karstensen, K., Milheim, L. E., & Roig-Silva, C. M. (2013). Consequences of Land Use and Land Cover Change (No. 2013-3010). US Geological Survey.
Springmann, M., Clark, M., Mason-D’Croz, D., Wiebe, K., Bodirsky, B. L., Lassaletta, L., … Willett, W. (2018). Options for keeping the food system within environmental limits. Nature, 562(7728), 519–525. https://doi.org/10.1038/s41586-018-0594-0
Steffen, W, Richardson, K., Rockström, J., Cornell, S.E., Fetzer, I., Bennett, E.M., Biggs, R., Carpenter, S.R., de Vries, W., de Wit, C.E., Folke, C., Gerten, D., Heinke, J., Mace, G.M., Persson, L.M., Ramanathan, V., Reyers, B. and Sörlin, S. (2015). Planetary boundaries: Guiding human development on a changing planet. Science 347 (6223)
Steffen, W., Richardson, K., Rockström, J., Cornell, S. E., Fetzer, I., Bennett, E. M., … & Folke, C. (2015). Planetary boundaries: Guiding human development on a changing planet. Science, 347(6223), 1259855.
Storch, D., Keil, P., Jetz, W. (2012). Universal species-area and endemic-area relationships at continental scales. Nature 488, 78–83.
Tambosi, L. R., & Metzger, J. P. (2013). A framework for setting local restoration priorities based on landscape context. Natureza & Conservação, 11(2), 152-157.
ten Brink, B., S. van der Esch, T. Kram and M. van Oorschot. (2010). Rethinking Global Biodiversity Strategies: Exploring structural changes in production and consumption to reduce biodiversity loss. Netherlands Environmental Assessment Agency, Bilthoven, The Netherlands. http://www.pbl.nl/en/publications/2010/Rethinking_Global_Biodiversity_Strategies.html.
Torralba, M., Fagerholm, N., Burgess, P. J., Moreno, G., & Plieninger, T. (2016). Do European agroforestry systems enhance biodiversity and ecosystem services? A meta-analysis. Agriculture, ecosystems & environment, 230, 150-161.
Torrecilla, N. J., Galve, J. P., Zaera, L. G., Retamar, J. F., & Alvarez, A. N. (2005). Nutrient sources and dynamics in a Mediterranean fluvial regime (Ebro river, NE Spain) and their implications for water management. Journal of Hydrology, 304(1-4), 166-182.
Tuck, S. L., Winqvist, C., Mota, F., Ahnström, J., Turnbull, L. A., & Bengtsson, J. (2014). Land-use intensity and the effects of organic farming on biodiversity: a hierarchical meta-analysis. Journal of Applied Ecology, 51(3), 746-755.
Turner K.G., Anderson S., Gonzales-Chang M., Costanza R., Courville S., Dalgaard T., Dominati E., Kubiszewski I., Ogilvy S. & Porfirio L. (2016). A review of methods, data, and models to assess changes in the value of ecosystem services from land degradation and restoration. Ecological Modelling 319:190–207.
UNIO Corporació Alimentària. (2018). Eco-sustainabiliy Study report Carbon footprint almond paste. Unió Corporació Alimentària
van der Hoek, Y., Zuckerberg, B., & Manne, L. L. (2015). Application of habitat thresholds in conservation: Considerations, limitations, and future directions. Global Ecology and Conservation, 3, 736–743. https://doi.org/10.1016/j.gecco.2015.03.010
van Rooij, W. and E. Arets. (2016). Biodiversity footprint assessment for leading companies. Technical summary. Platform Biodiversity, Ecosystems & Economy
van Rooij, W. and E. Arets. (2017). Biodiversity footprint of companies. Summary report. Platform Biodiversity, Ecosystems & Economy
van Rooij, W., E. Arets and J. Struijs. (2016). Eindrapport biodiversiteitsvoetafdruk voor koploperbedrijven. Platform Biodiversiteit, Ecosystemen en Economie http://edepot.wur.nl/401264.
van Zelm, R., A. M. Schipper, M. Rombouts, J. Snepvangers and M. A. J. Huijbregts. (2011). Implementing Groundwater Extraction in Life Cycle Impact Assessment: Characterization Factors Based on Plant Species Richness for the Netherlands. Environmental Science & Technology 45:629-635.
Vitousek, P. M., Aber, J. D., Howarth, R. W., Likens, G. E., Matson, P. A., Schindler, D. W., … & Tilman, D. G. (1997). Human alteration of the global nitrogen cycle: sources and consequences. Ecological applications, 7(3), 737-750.
Weih, R. C. and Riggan, N. D. (2010). Object-based classification vs. pixel-based classification: comparative importance of multi-resolution imagery. GEOBIA, pages 1–6.
WWF (2018). Living Planet Report – 2018: Aiming Higher. Grooten, M. and Almond, R.E.A.(Eds). WWF, Gland, Switzerland.
WWF (2018a). Mediterranean Forests, woodlands and scrubs. Retrieved at https://www.worldwildlife.org/biomes/mediterranean-forests-woodlands-and-scrubs
Yada, S., Lapsley, K., & Huang, G. (2011). A review of composition studies of cultivated almonds: Macronutrients and micronutrients.
Yadav, G. S., Datta, R., Pathan, S. I., Lal, R., Meena, R. S., Babu, S., … Mishra, P. K. (2017). Effects of conservation tillage and nutrient management practices on soil fertility and productivity of rice (Oryza sativa L.)-rice system in North eastern region of India. Sustainability (Switzerland), 9(10). https://doi.org/10.3390/su9101816
Zeller, K. A., McGarigal, K., & Whiteley, A. R. (2012). Estimating landscape resistance to movement: a review. Landscape Ecology, 27(6), 777-797.