Insights from
spatial data
When it comes to science-based targets, accounting for impacts and dependencies on nature is just as important as accounting for carbon emissions. Only by addressing both can we move towards a decarbonized, nature-positive business model. The difference is that when it comes to nature, knowing where company activities are located and the context of those regions is critical for an accurate understanding of the impacts.
As society’s reliance on a healthy natural system becomes increasingly clear, more and more companies are starting to go beyond assessments for climate change and to also measure the impacts and dependencies of their supply chains on nature. Knowing the location of significant impacts and dependencies allows companies to better prioritize where to take action and change operations.
While climate change is a global phenomenon where the CO2-eq emissions from each country collectively contribute to planetary warming, interactions with nature — be it water, biodiversity, or land/soil — are felt more locally. This makes impacts on nature more difficult to measure accurately, though certainly no less important. If too many local natural systems collapse, it will impact our ability to produce food, breathe clean air, use fresh water, and live in resilient cities. Without a local perspective, a large share of supply chain impact on nature will be overlooked, potentially leading companies to experience regulatory risks, poor public perception, and disruptions to raw material availability.
One organization leading the push for such fine-grained methods is the Science Based Targets Network. The SBTN brings together experts from more than 45 NGOs, business associations and consultancies to collectively define what is necessary to do “enough” to stay within Earth’s limits and meet society’s needs. It responds to the demand for more methods, guidance and tools to set science-based targets for nature, specifically climate, land, water, oceans.
Let’s explore why accounting for location is important when measuring impacts on nature, and how companies can start with a minimal amount of data. While we focus mostly on the topic of water as an example, the thinking and methods that we describe here can be applied to other systems, including biodiversity and land/soil.
Why water
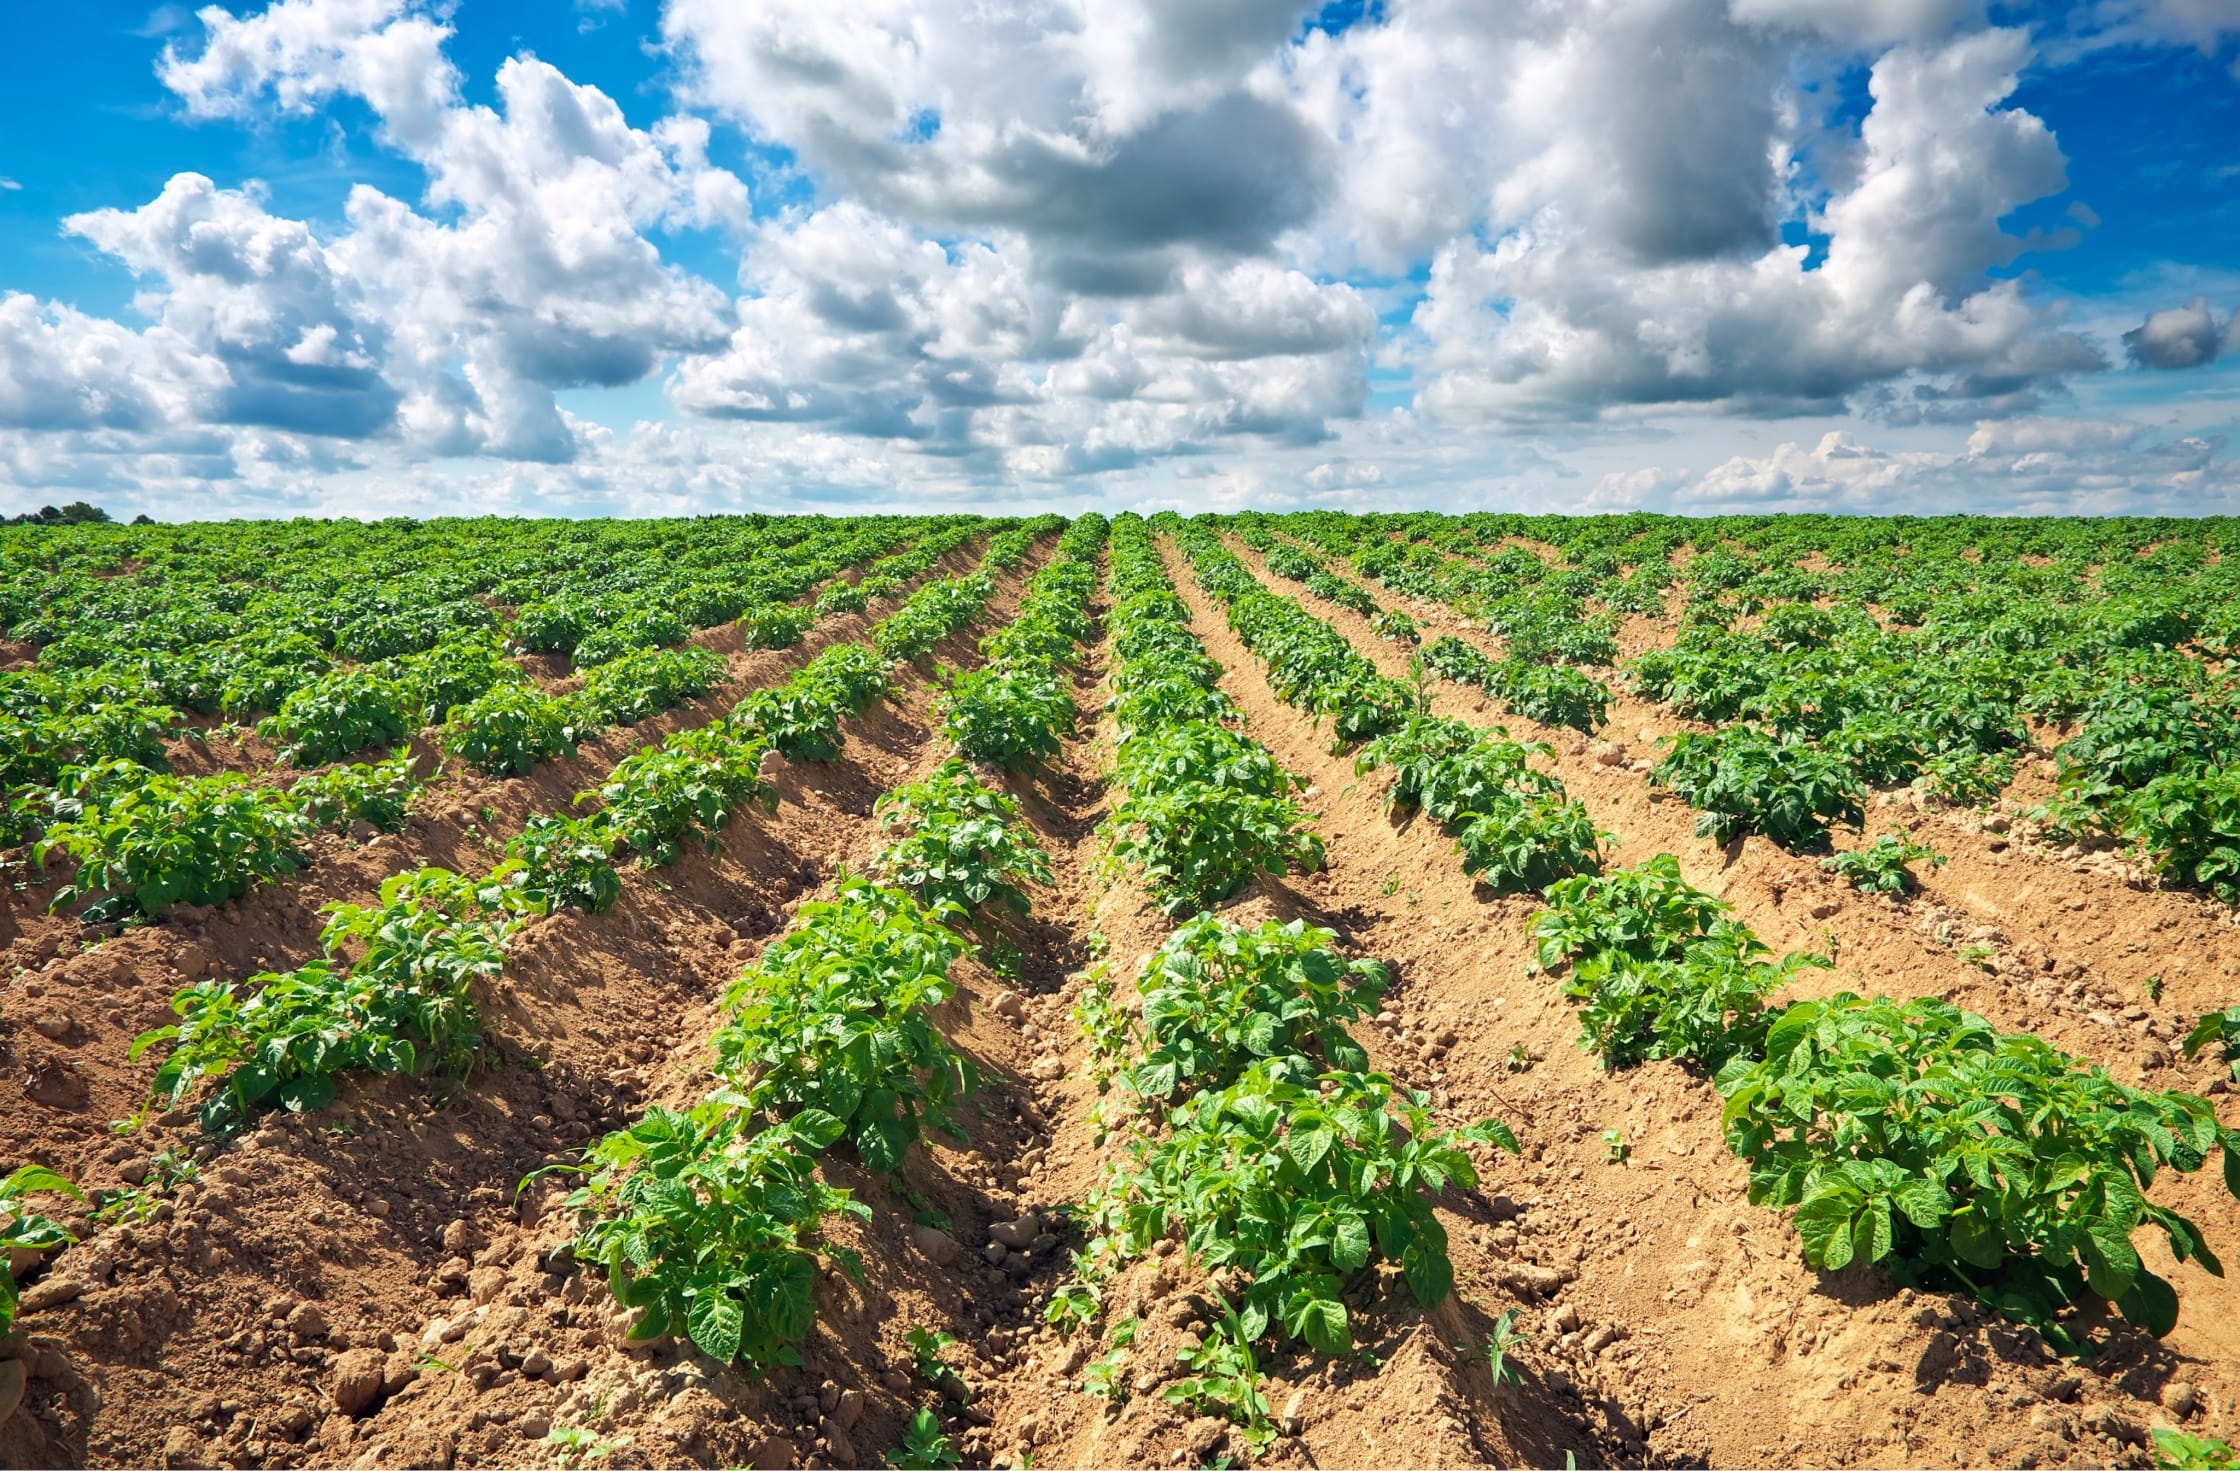
Imagine you are the owner of a company that makes oven-baked potato chips (salt and vinegar, BBQ, pickles — pick your favorite flavor) using the highest quality potatoes. Having been in this business for a while, you know your supply chain is dependent on water to grow potatoes. Could droughts disrupt your potato supply? Does your use of water contribute to local water shortages or pollution?
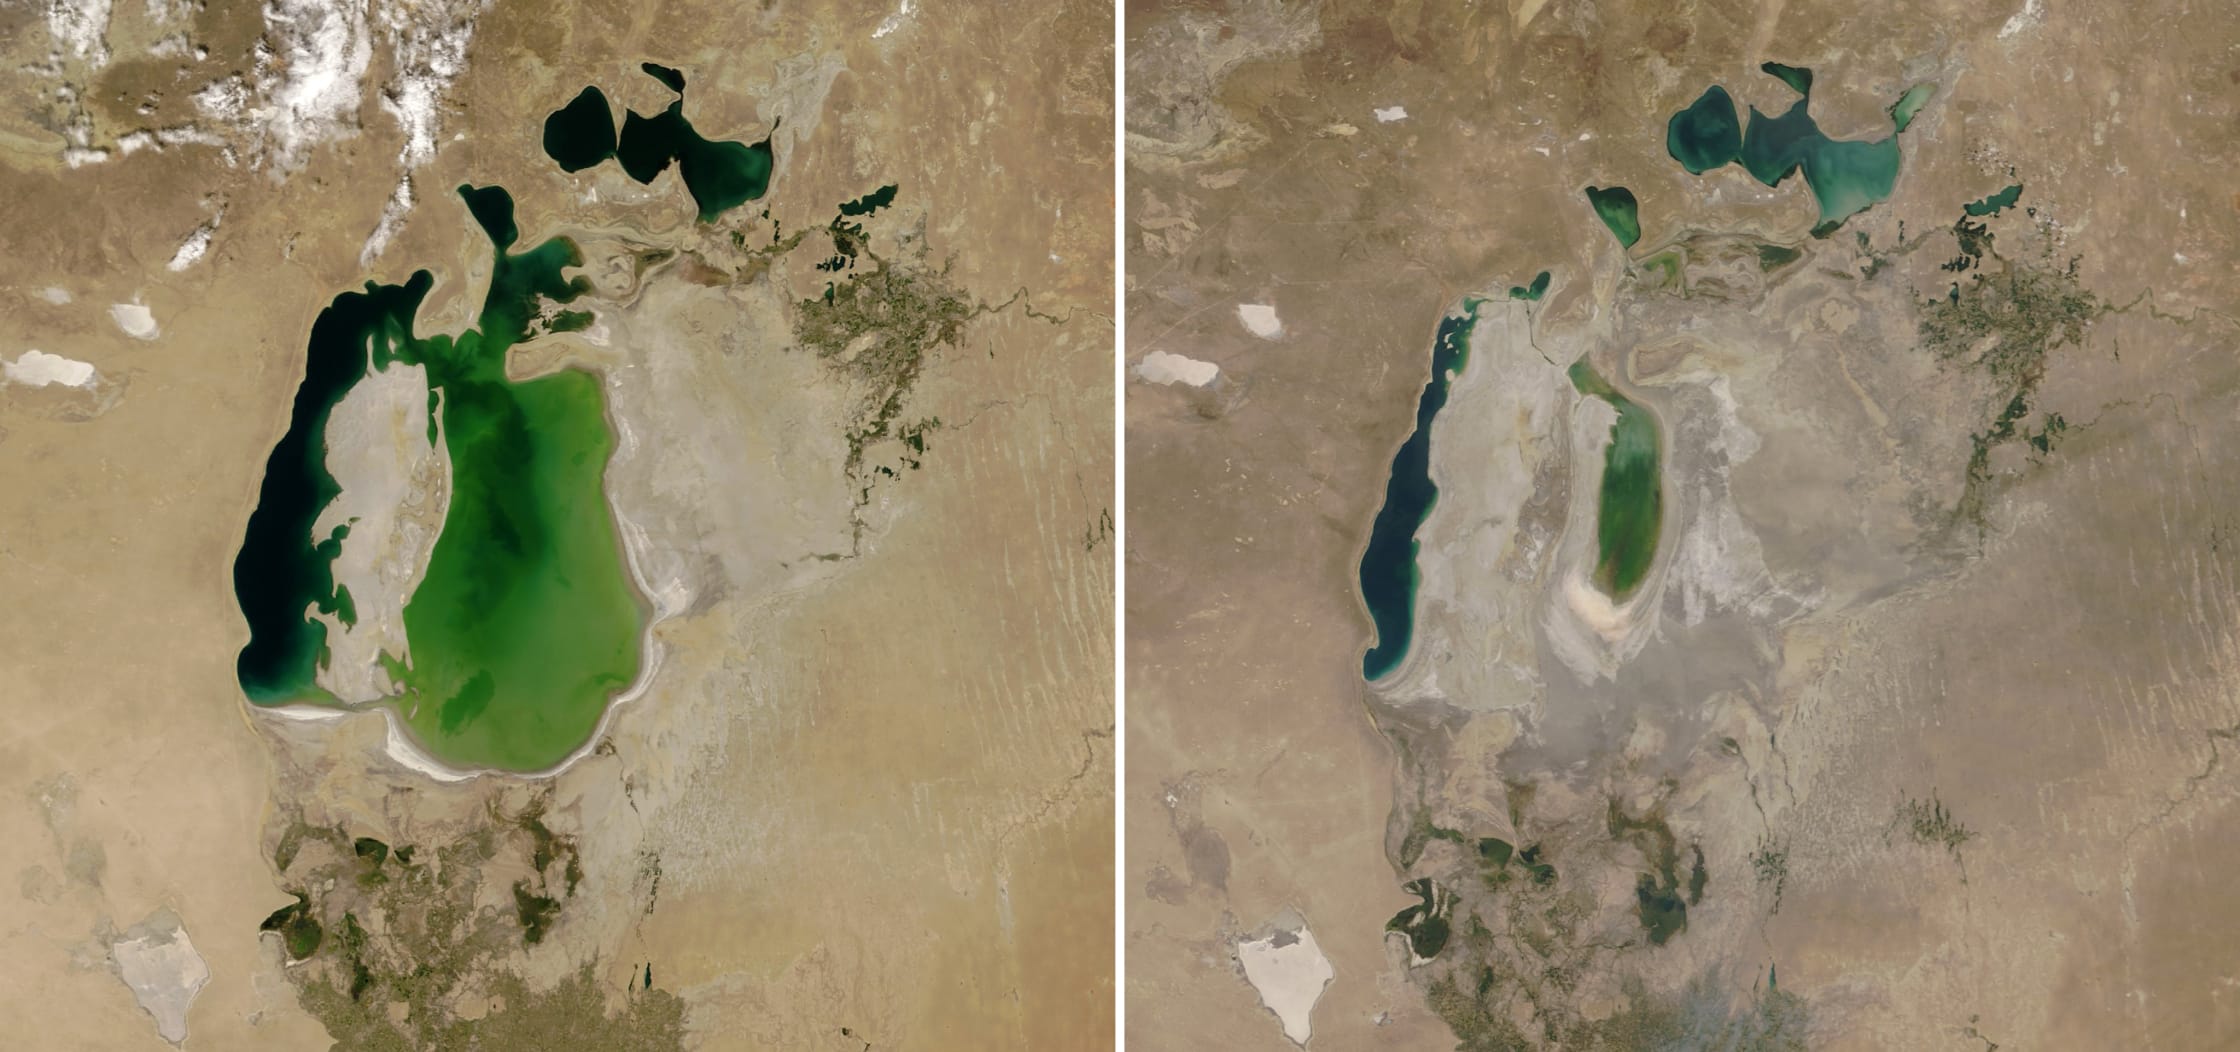
While we are looking at a hypothetical scenario, we have seen what happens when companies do not consider these questions. Up until the 1960s, the Aral Sea between Uzbekistan and Kazakhstan was the fourth largest freshwater lake in the world. However, due to high water demand for crop irrigation, part of the lake essentially dried out in 2014. This decimated the ecosystem and the nearby fishing and agricultural communities, affecting millions of people and leading to the loss of almost 160,000 jobs in the region.
As a business owner, what can you do to make sure something like this does not happen in your supply chain? What kind of information do you need?
Location is key
Your first step might be to calculate the water footprint of your entire potato sourcing portfolio: “How much water was used to grow all the potatoes we bought in one year?” It’s fairly easy to express how much water is required to produce agricultural products such as potatoes, in this case, 287m3 of water per tonne. But we are not stopping here. This is just the beginning of our assessment.
While issues such as climate change have a global impact regardless of the exact location of emission sources, the impact of unsustainable human activity on nature is felt locally. In the case of water, it is not just about how much water is being used, but also the local context around water availability. Let’s take a look at the two hypothetical regions where our potato chip company sources its potatoes: Mexico and France.
Mexico is a warm country with desert-like regions in the northwest, and tropical, hot, and humid regions along the coast. In the capital, Mexico City, temperatures can stay above 20°C year-round.
Loading graph…
Meanwhile, France has a mostly temperate climate. It is generally cold in the winter and mild in the summer, with rainfall throughout the year. In the capital, Paris, temperatures only reach 20°C in the summer.
Loading graph…
Local climate affects the availability of water. Hotter weather means that water evaporates faster, and if it is not replenished through rainfall or snowmelt, it can lead to drought. If we extract water from already hot and dry places (to grow potatoes for example), it can potentially lead to desertification and biodiversity loss, making it even harder for humans to operate in those areas. That’s what we saw with the Aral Sea.
The same logic holds true for other natural systems, such as biodiversity. The impact of agriculture-driven deforestation in the Amazon rainforest is different from the same amount of deforestation in Siberia. Even though both should be minimized, protecting the Amazon might warrant more urgency.
If your company is buying potatoes from Mexico, where water might already be scarce, the associated impacts (e.g. reduced water availability for local communities) and risks (e.g. increased chance of crop failure due to drought) will be higher than buying them from a cooler country like France.
As the person responsible for raw material procurement in the potato chip company, you might wonder, “How can I include such complex factors in my decision-making?”
Water risk
Over the past decade, companies, governments, and scientific institutions have been teaming up to create better tools to support sustainability decision-making. One such tool is the Aqueduct Water Risk Atlas, created in part by the World Resource Institute (WRI). This tool rates watersheds all over the world based on their ability to provide clean water. A watershed is an area of land where all of the water that drains from it goes into the same place, such as a river, stream, lake.
A region with a poor score on Aqueduct means that the availability of water is at risk due to conditions like drought, flooding, or poor water quality, and that any further water use for agriculture or human consumption should be considered carefully. A region with a good score means that water will likely continue to be available.
Combining the water risk atlas with water footprinting allows us to quickly identify regions where water use is potentially impacting local communities and ecosystems, and where there might be risks in the future. For a real world example of this, take a look at the work we did with plant-based food and drink producer Alpro.
For example, we can see that most of Mexico is under high or extreme water risk. This is just as we expected earlier when we were considering the climate of our two hypothetical growing regions. Severe drought in the north is actually so bad that it has prompted the Mexican government to seed clouds with silver iodide in hopes of making it rain.
On the other side of the world, most of France is rated as medium water risk, with the risk level increasing in the north due to competition for water resources.
The issue with just looking at these water risk maps alone is that potatoes are not grown uniformly everywhere in France and in Mexico. While we do not have exact farm locations, we can still narrow down the locations a bit better. This spatial specificity comes from another amazing spatial dataset called MapSPAM.
Combining data
MapSPAM is an open spatial dataset developed by a consortium of NGOs that shows where different crops are grown around the world.
Combining this dataset with WRI’s Aqueduct water risk map, we can compare where potatoes are grown with the water risk of those regions.
In Mexico, we see that while potato production is clustered throughout the country, a lot of it is located in areas in the north with high and extreme water risk (and the artificial rain).
In France, we see that while most of the country is considered medium risk, a large portion of potatoes are actually grown in the northern regions. This might help explain the competition for water resources that leads to the high risk score.
Now we can compare the potato production between countries and account for the local water context. For example, using the combination of MapSPAM and Aqueduct, we can calculate that almost 80% of potatoes in Mexico are grown in areas of high or extreme water risk while in France, 40% of potatoes are grown in areas of high water risk.
If your potato sourcing is equally split between these two countries, you would want to take a closer look at operations in Mexico to address any potential risks in your supply chain.
Next steps
The next step is to work with suppliers in high-priority areas. This may involve pinpointing the location of the farms and assessing their specific water consumption and risk. Once individual farms are identified, you and/or your suppliers could work with farmers to investigate the potential for regenerative farming practices to reduce the reliance on water extraction, or work with other landscape stakeholders on transformational change to reduce the water risk of the region. This ensures that both local communities and your supply chain remain healthy long into the future and that ecological catastrophes, like that of the Aral Sea, are averted.
The benefit of this approach is that companies do not have to know the exact location of all their supplying farms to understand their impacts and dependencies, and they only need to dig deeper in areas of high priority. In reality, the assessment does not completely end here. As part of a full, systematic assessment, all relevant stages of a supply chain (upstream production, processing, distribution, use, and waste handling) should be analyzed in a similar way: with location in mind. Only then can a company have a complete understanding of the impact of its operations, and know where to take action to achieve the most meaningful results.
Getting started with setting science-based targets for nature is difficult. Natural systems are complex and the lack of transparency in supply chains makes it difficult to fully understand impacts and dependencies. However, the use of existing spatial data goes a long way to reduce both of these barriers.
Companies need very little information to start their journey towards a fundamentally sustainable operation. While our example focused on water, the same approach applies to biodiversity and land/soil. In fact, it is critical to consider these as well so that attempts to improve one aspect of an ecosystem will not in turn harm another. Similar to the WRI Aqueduct water risk model, companies can use tools like the Global Safety Net (showing areas of the world where biodiversity needs further protection) and Trends.earth (assessing where land is degrading, stable, or improving).
In the end, NGOs, governments, and the World Bank made major efforts to restore the Aral Sea. Today, fishing communities have begun to recover, but the ecosystem is still degraded and the Aral Sea will likely never return to its former glory. Using location-based impact assessments, companies can prevent this kind of devastation, protecting ecosystems and livelihoods — and their supply chains.